This report provides a detailed breakdown of current Facebook advertising metrics and trends for 2026, including definitions of key terms found in Ads Manager reports and global performance benchmarks.
1. Key Performance Metrics Explained
Understanding the specific metrics used in your reports is essential for evaluating campaign success:
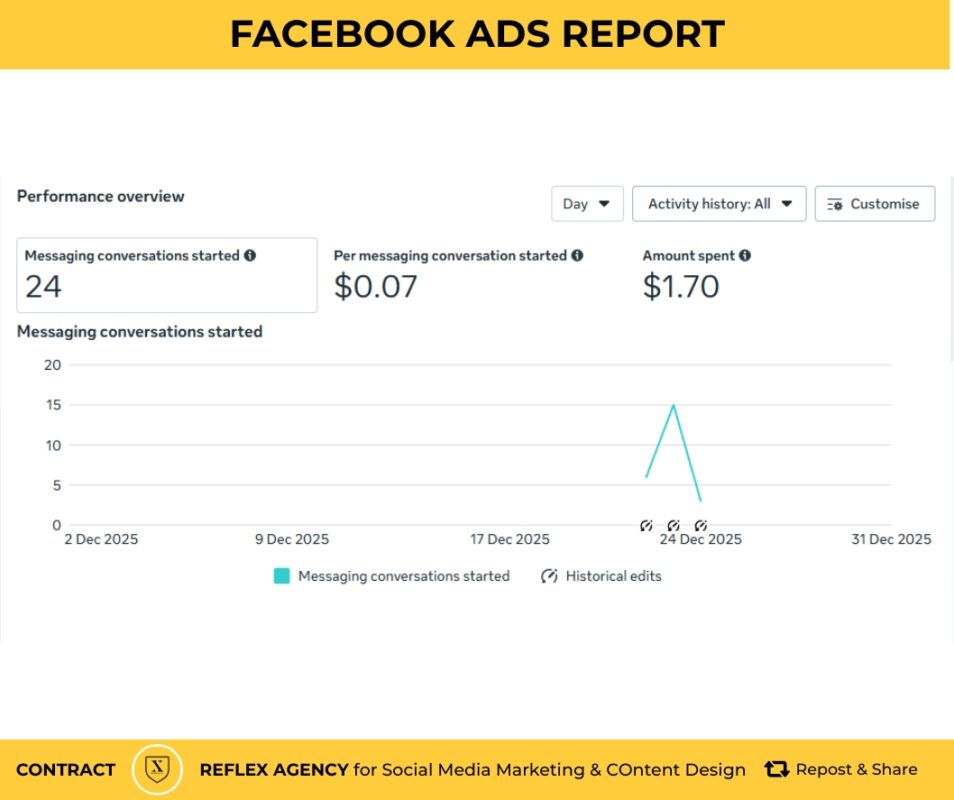
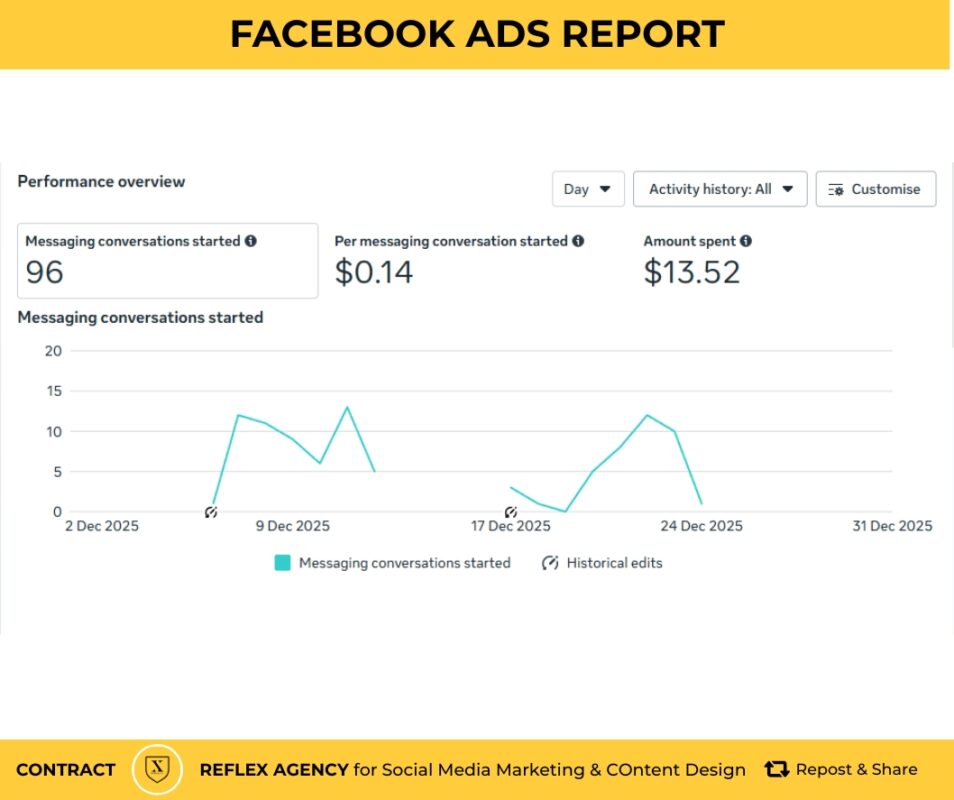
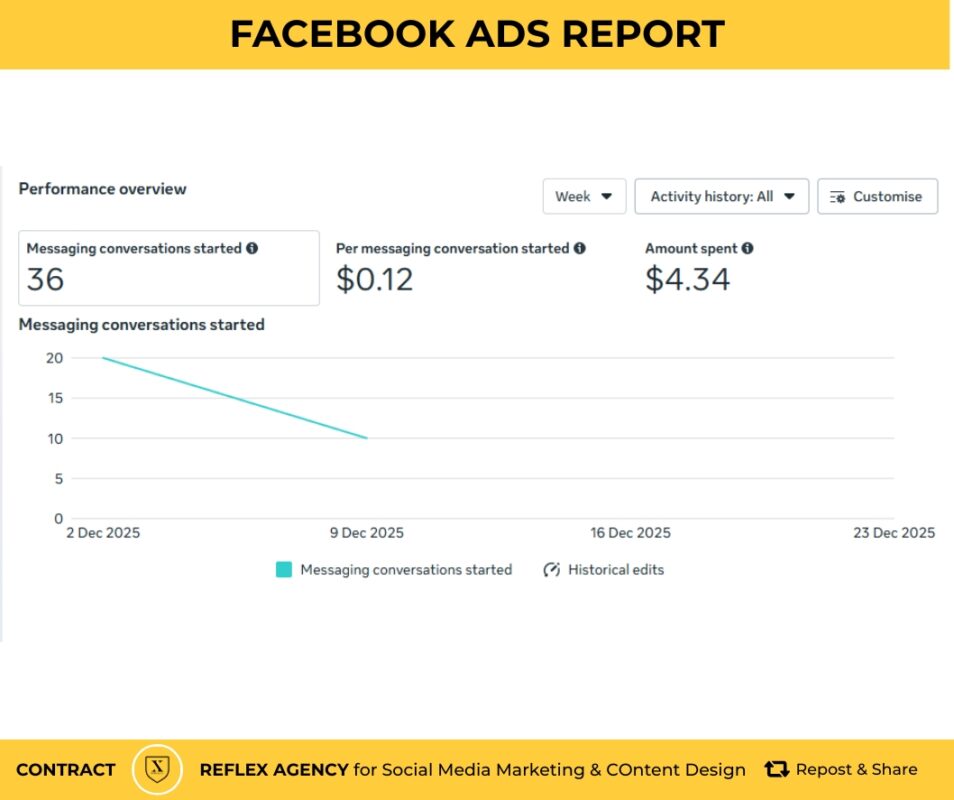
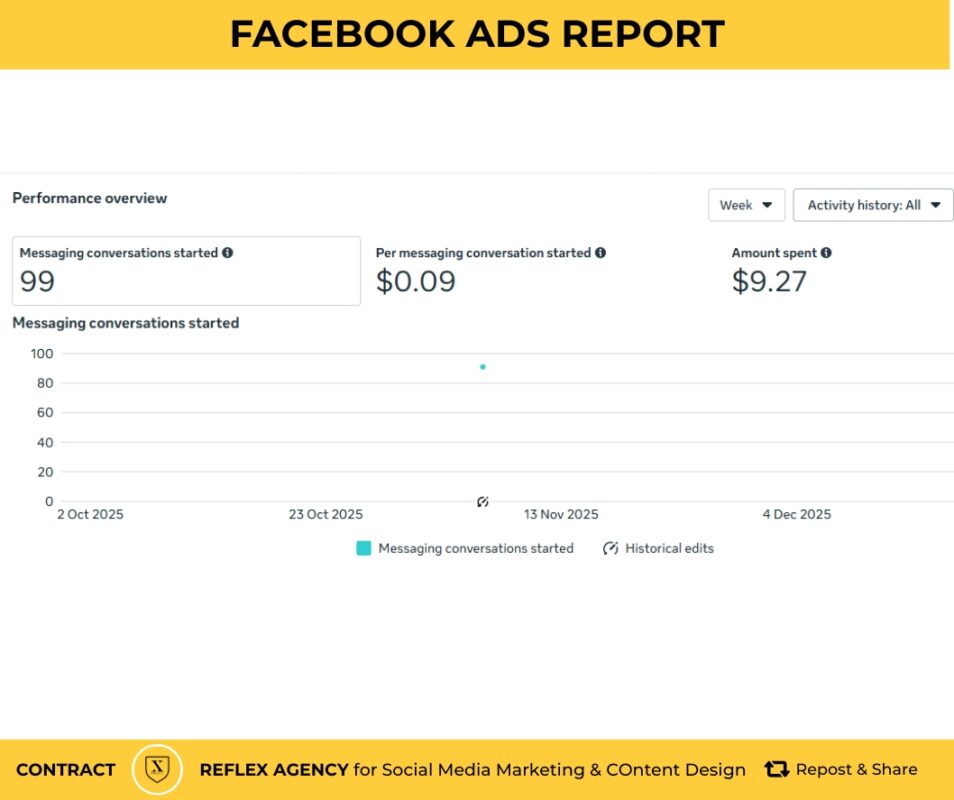
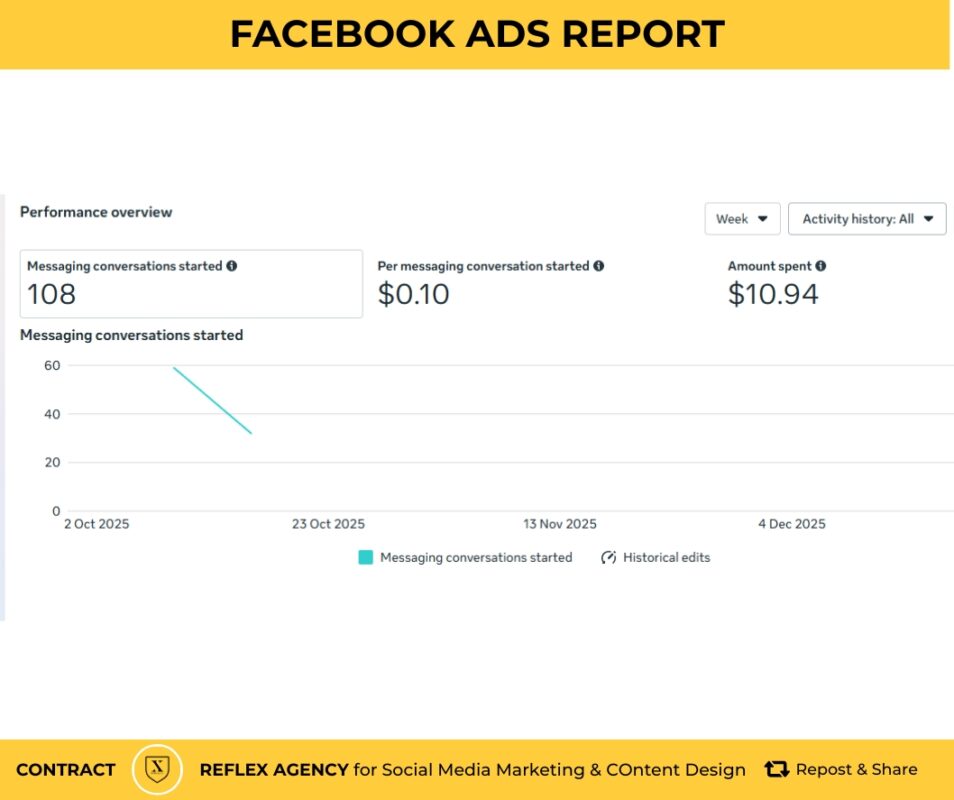
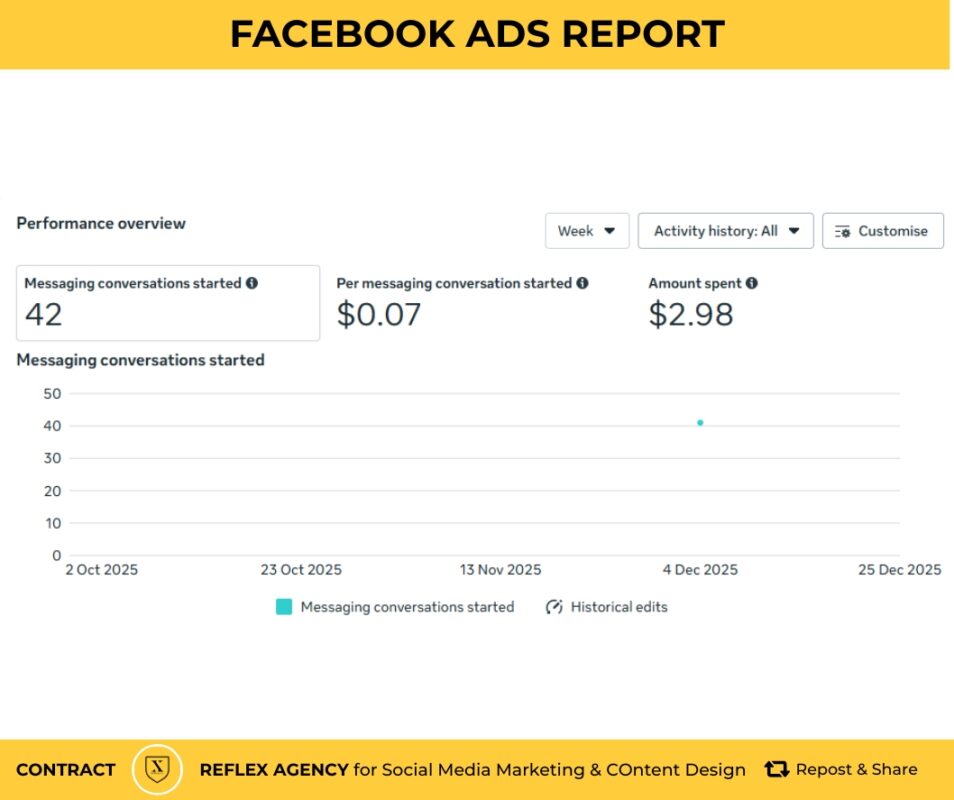
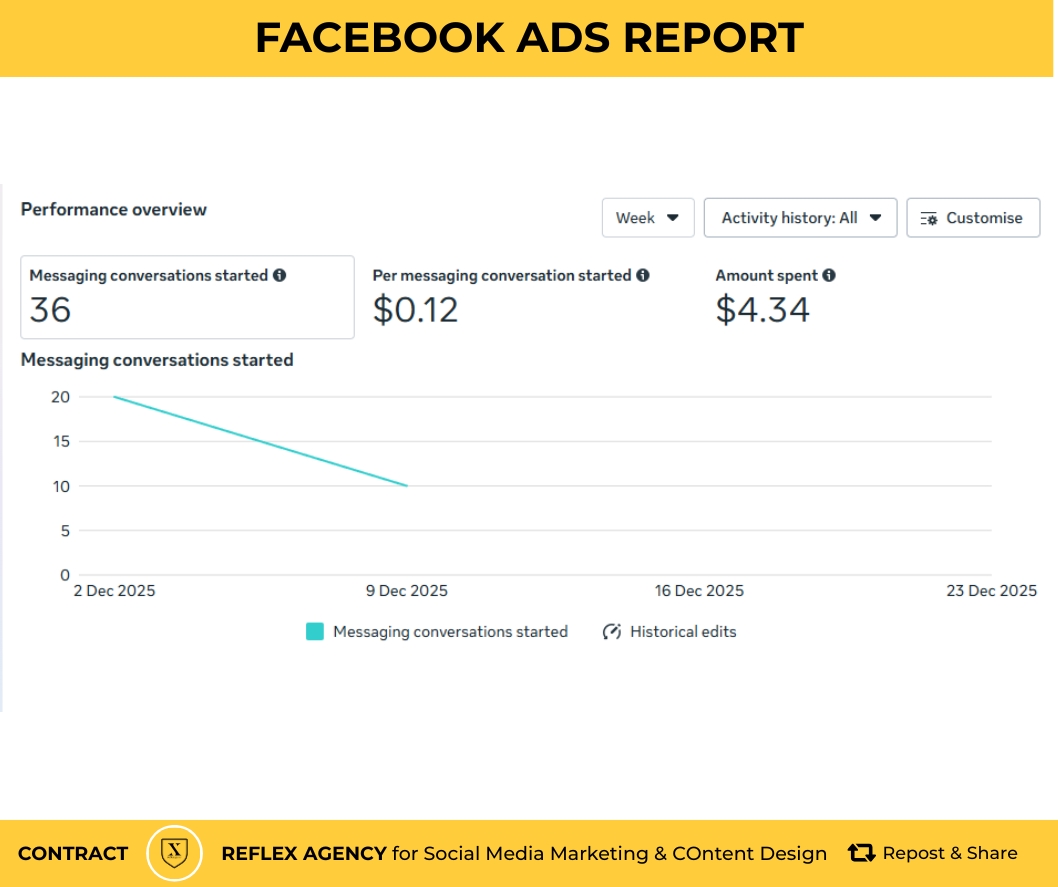
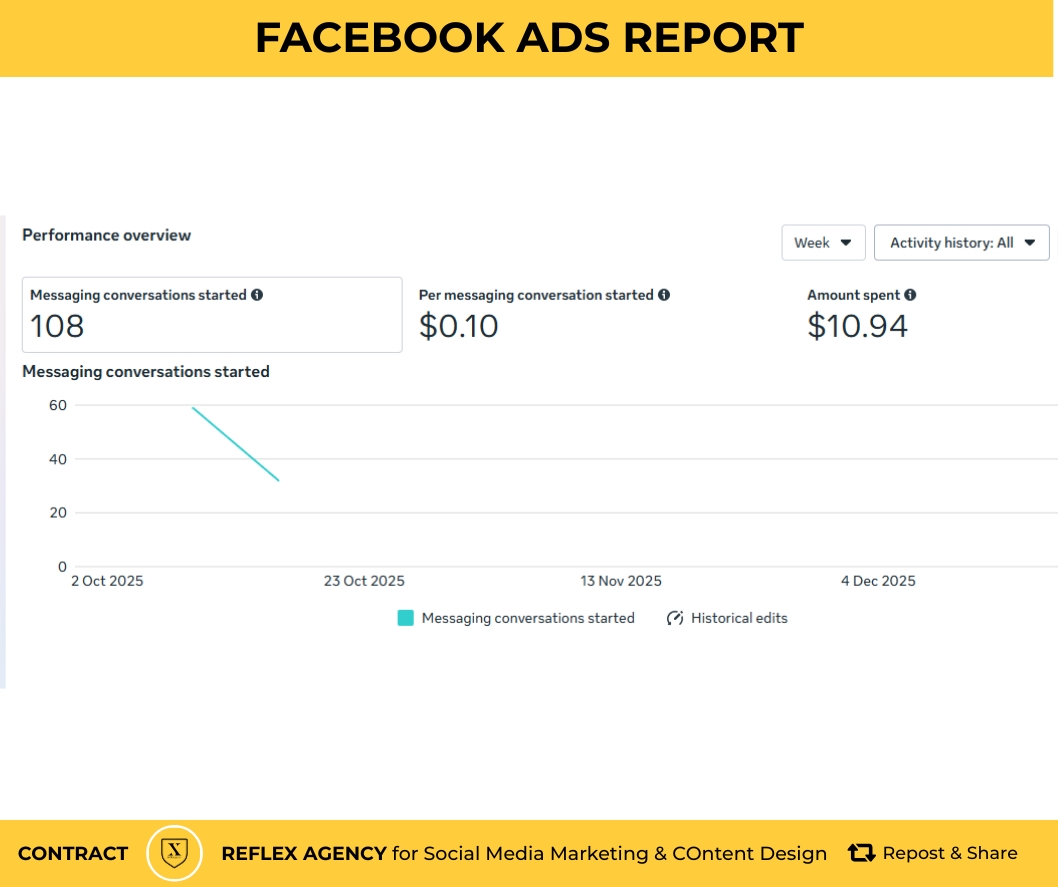
- Messaging Conversations Started: This counts how many times a new, two-way conversation began in a messaging app (Messenger, Instagram, or WhatsApp) after a user clicked your ad. It specifically tracks new interactions and typically excludes users who have messaged your business in the past.
- Historical Edits: This represents a comprehensive audit trail of all modifications made within your account. It includes changes to budgets, targeting, schedules, and creative elements. Comparing these edits to performance shifts helps identify which specific changes improved or harmed your results.
- CTR (Click-Through Rate): The percentage of users who saw your ad and clicked on it. It is a primary indicator of how well your creative resonates with your target audience.
- CPM (Cost Per 1,000 Impressions): The cost to show your ad to 1,000 sets of eyes. This is the standard metric for measuring brand awareness and reach.
2. Global Advertising Benchmarks (2026)
The following table outlines the median performance across all industries for early 2026:
| Metric | Average / Median | High Performance (Top 25%) |
| CPC (Cost Per Click) | $0.40 – $1.20 | Under $0.40 |
| CPM (Cost Per 1,000) | $6.00 – $15.00 | Under $5.00 |
| CTR (Click-Through Rate) | 0.90% – 1.60% | 2.50%+ |
| CPL (Cost Per Lead) | $10.17 – $19.68 | Under $8.68 |
| ROAS (Return on Ad Spend) | 2.5x – 2.79x | 4.5x+ |
3. Performance Factors & Trends in 2026
- Industry Variation: Costs remain highly dependent on your sector. Financial Services see high costs with an average CPC of $2.50, while Retail and Education enjoy lower costs, often between $0.50 and $0.60.
- Platform Efficiency: Facebook maintains the highest overall CTR at 0.90%, slightly outperforming Instagram’s average of 0.68% across all objectives.
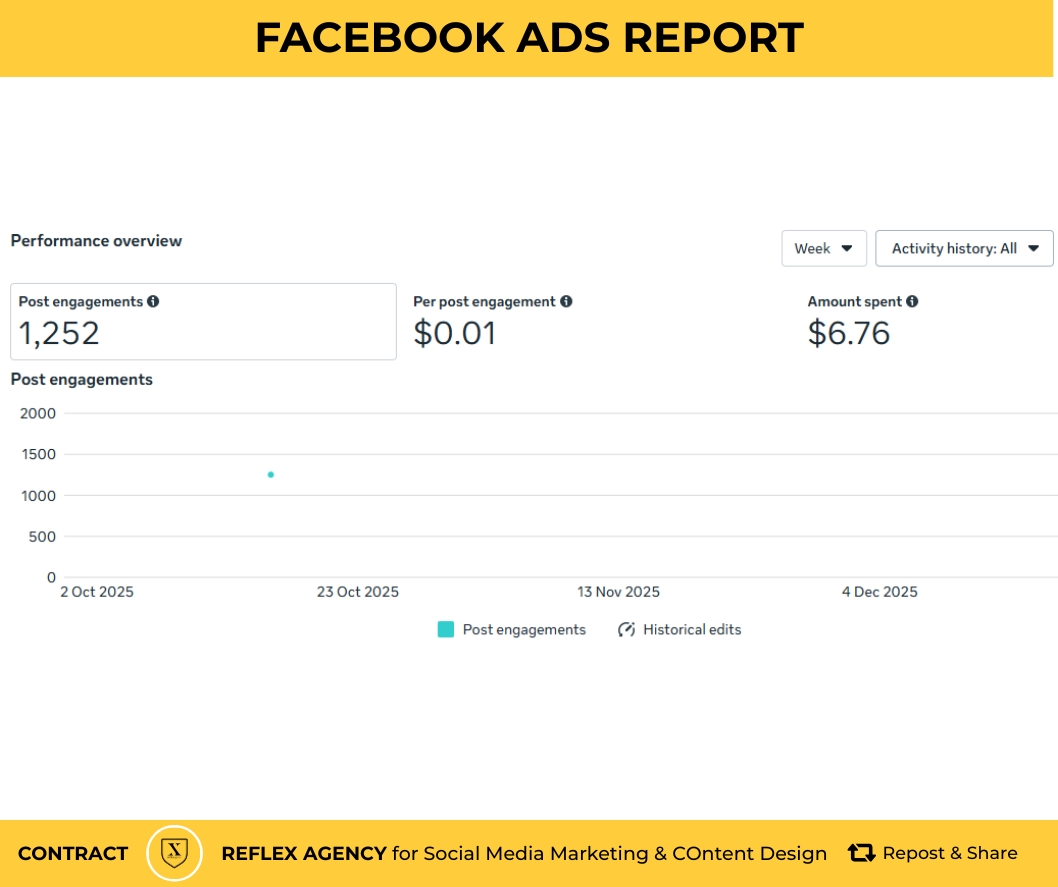
- Engagement Types: Standard post engagement (likes, shares, comments) typically costs between $0.01 and $0.02 per action on Facebook.
- Creative Formats: Vertical, mobile-friendly formats like Reels and Stories are currently dominant, generating an average of 12% more conversions than traditional static image formats.
- AI Implementation: Using Advantage+ campaigns is now standard for reducing costs, as it allows Meta’s algorithm more “liquidity” to find cheaper conversion opportunities.


