This detailed report provides an analysis of key performance metrics for Facebook advertising as of late 2025 and early 2026, including definitions of common terms and current industry benchmarks.
1. Key Performance Metrics Explained
Understanding these core metrics is essential for evaluating the success of your ad campaigns:
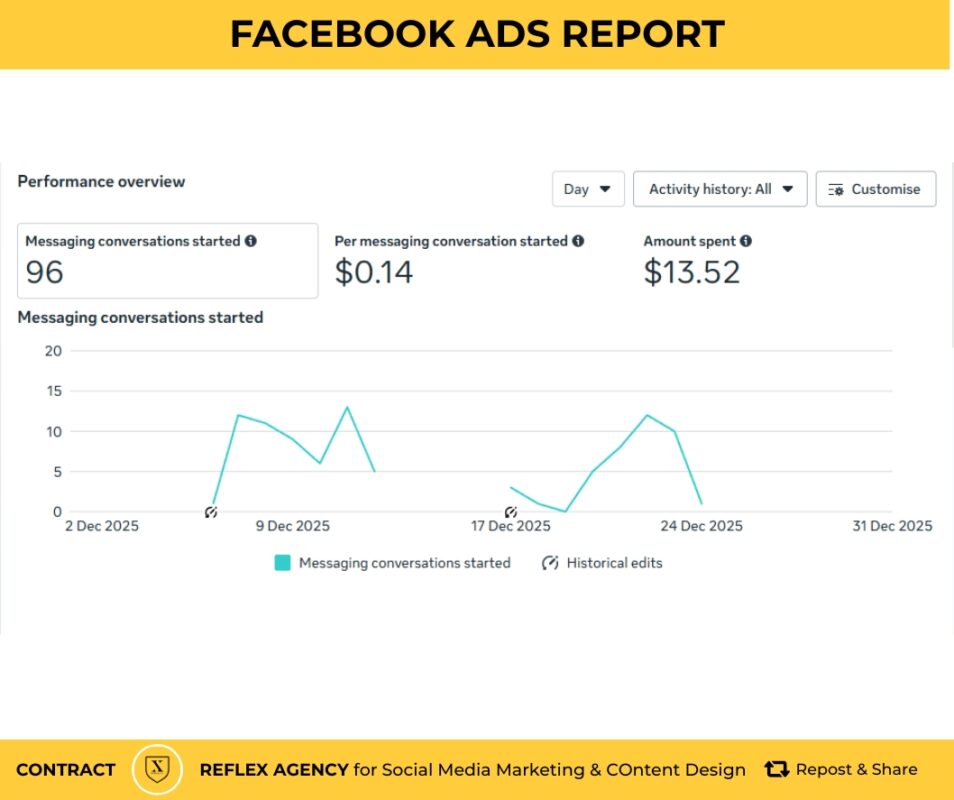
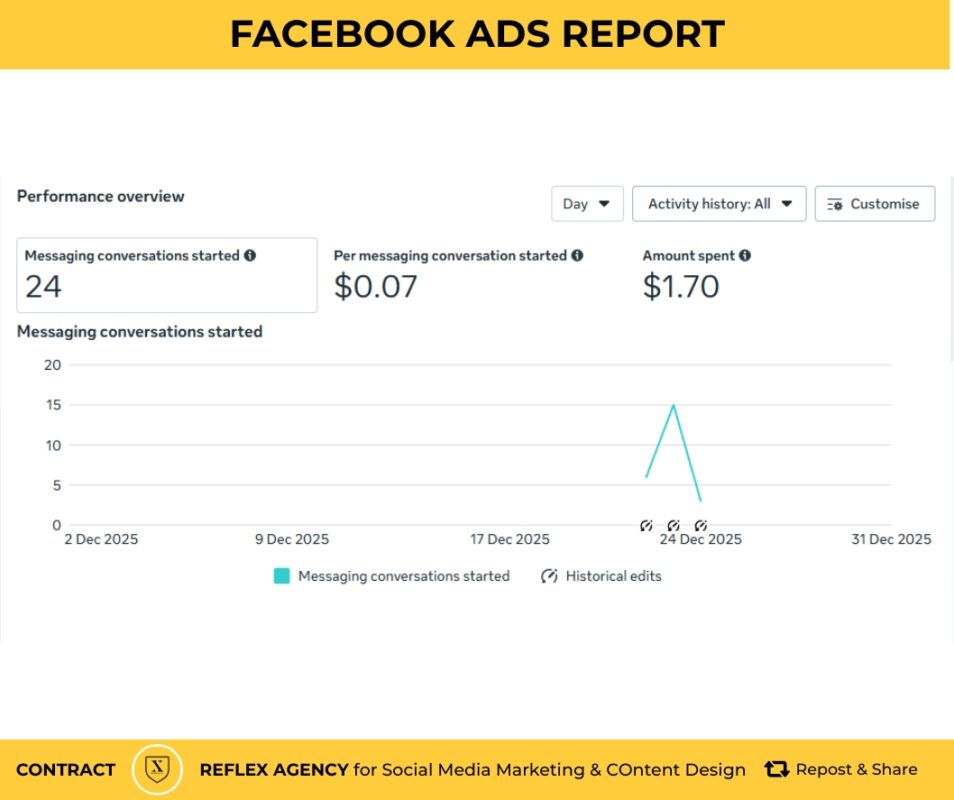
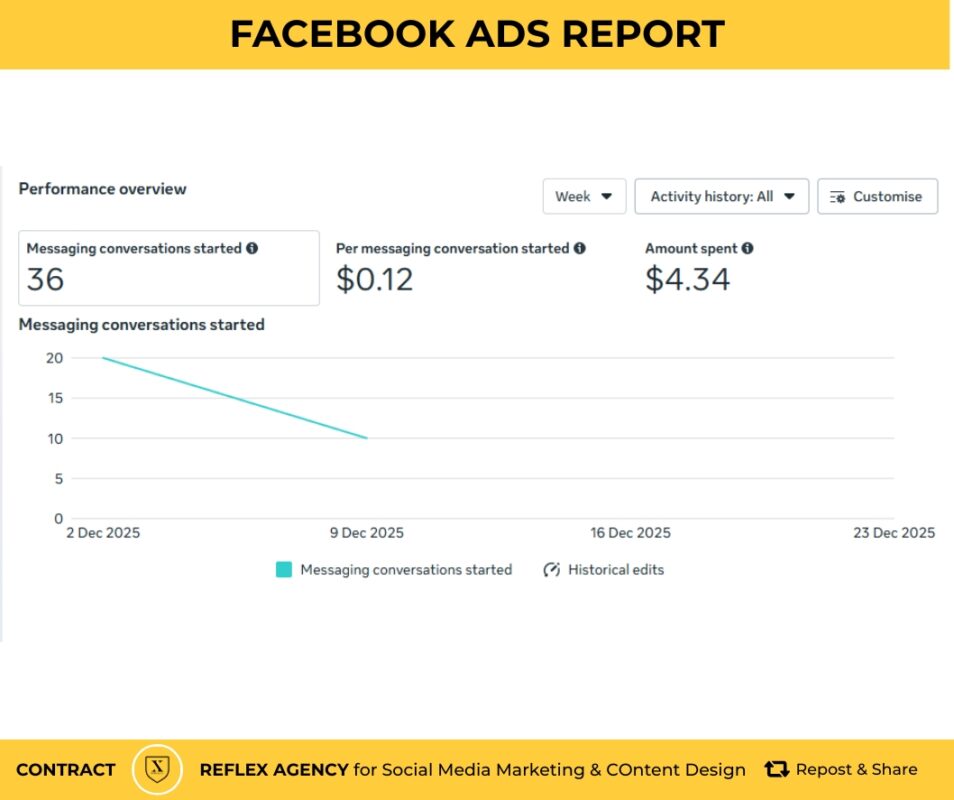
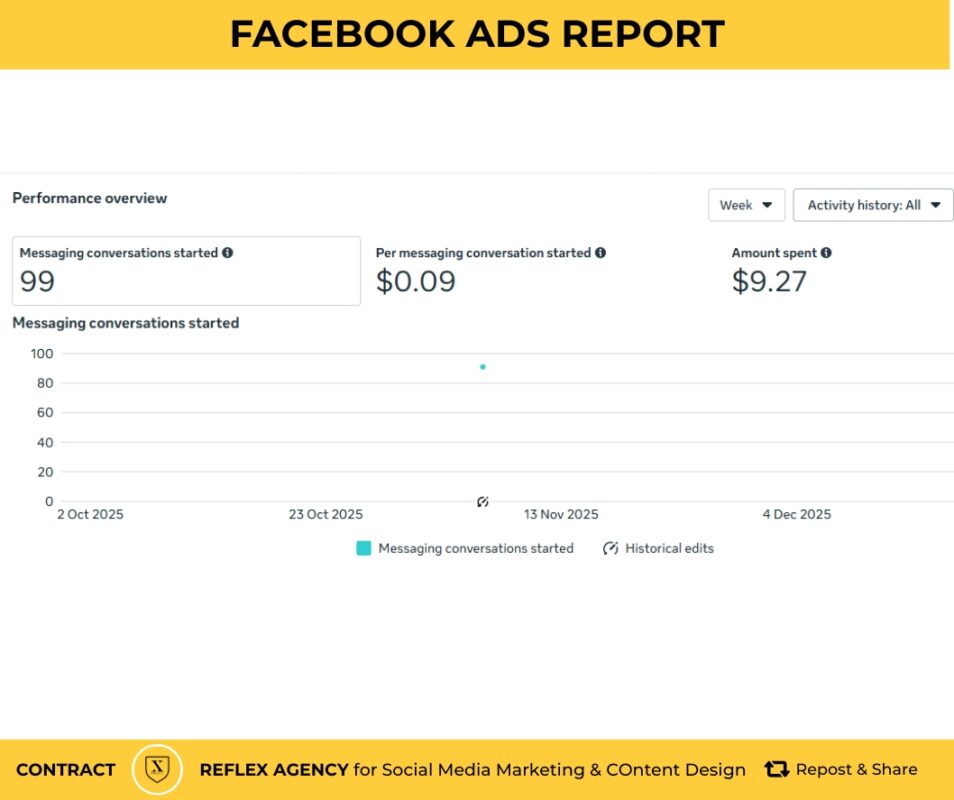
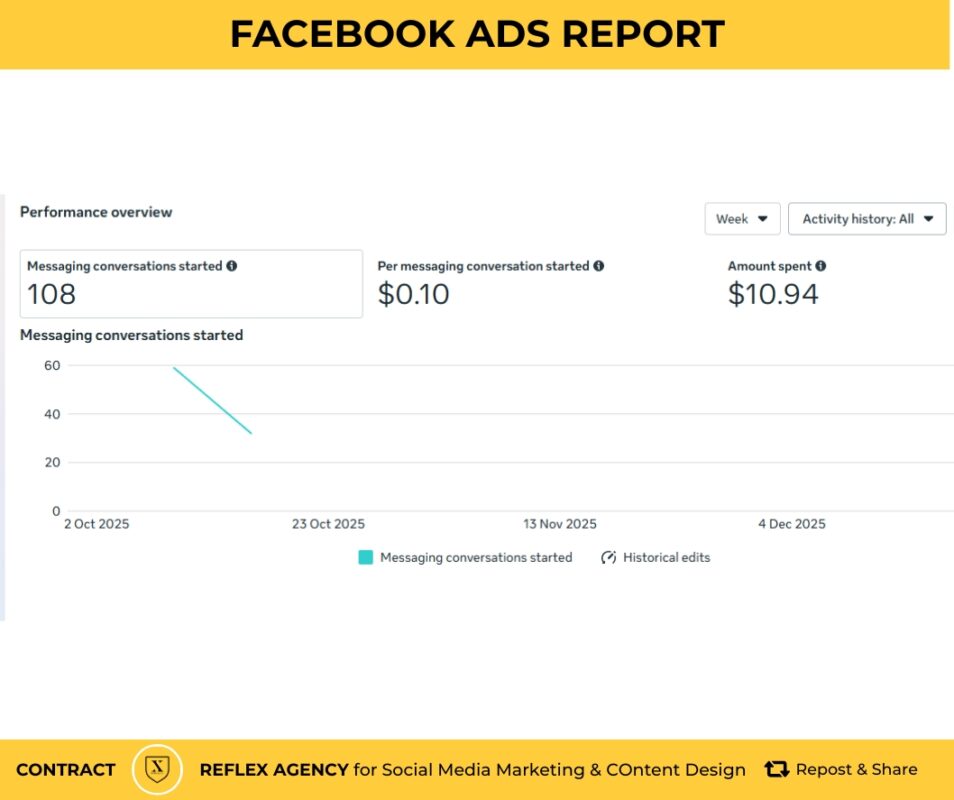
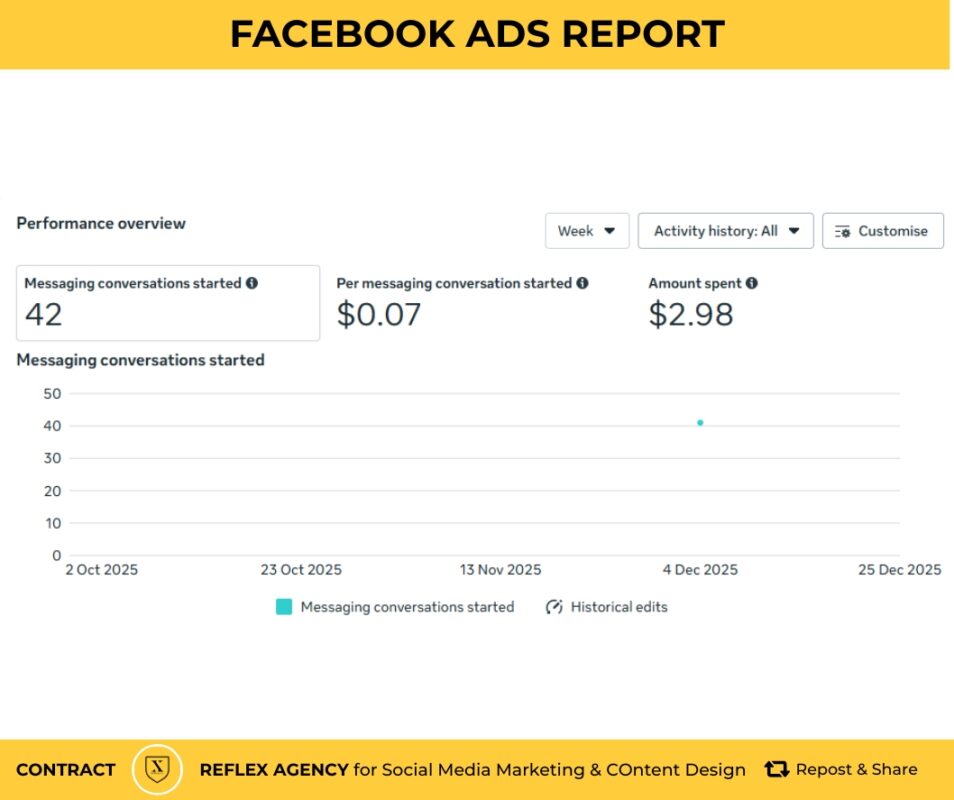
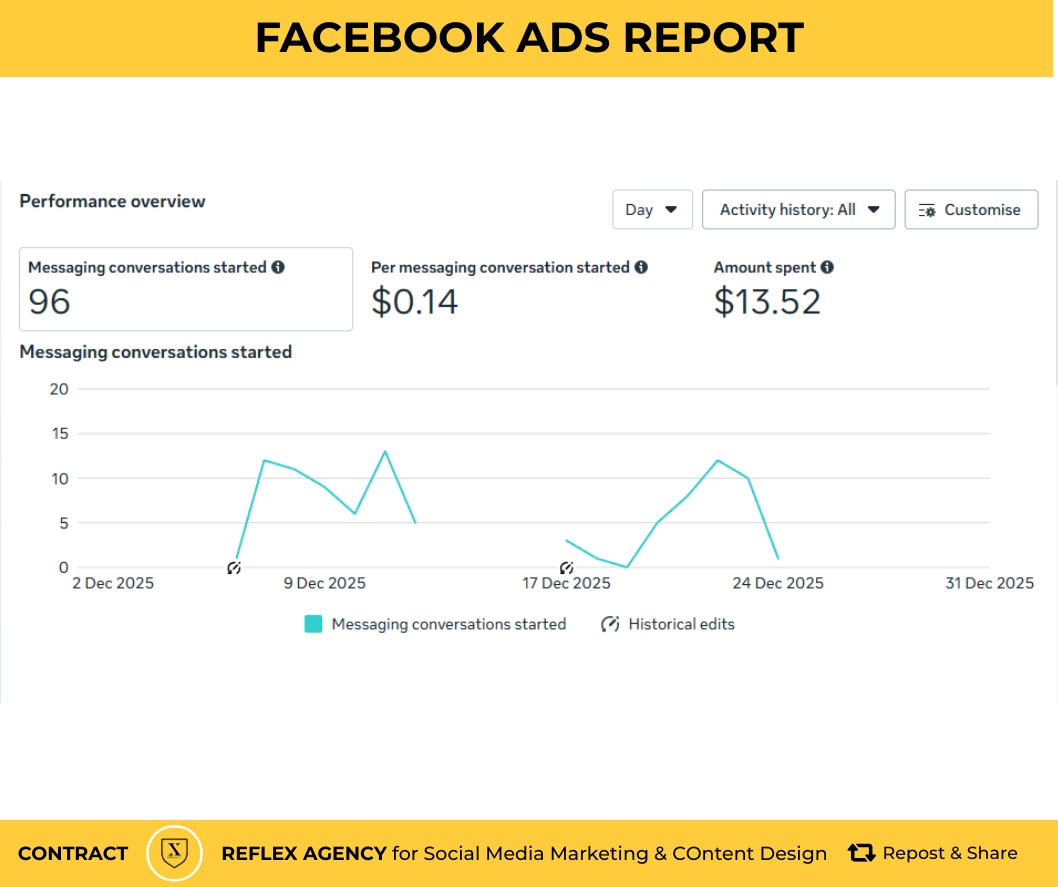
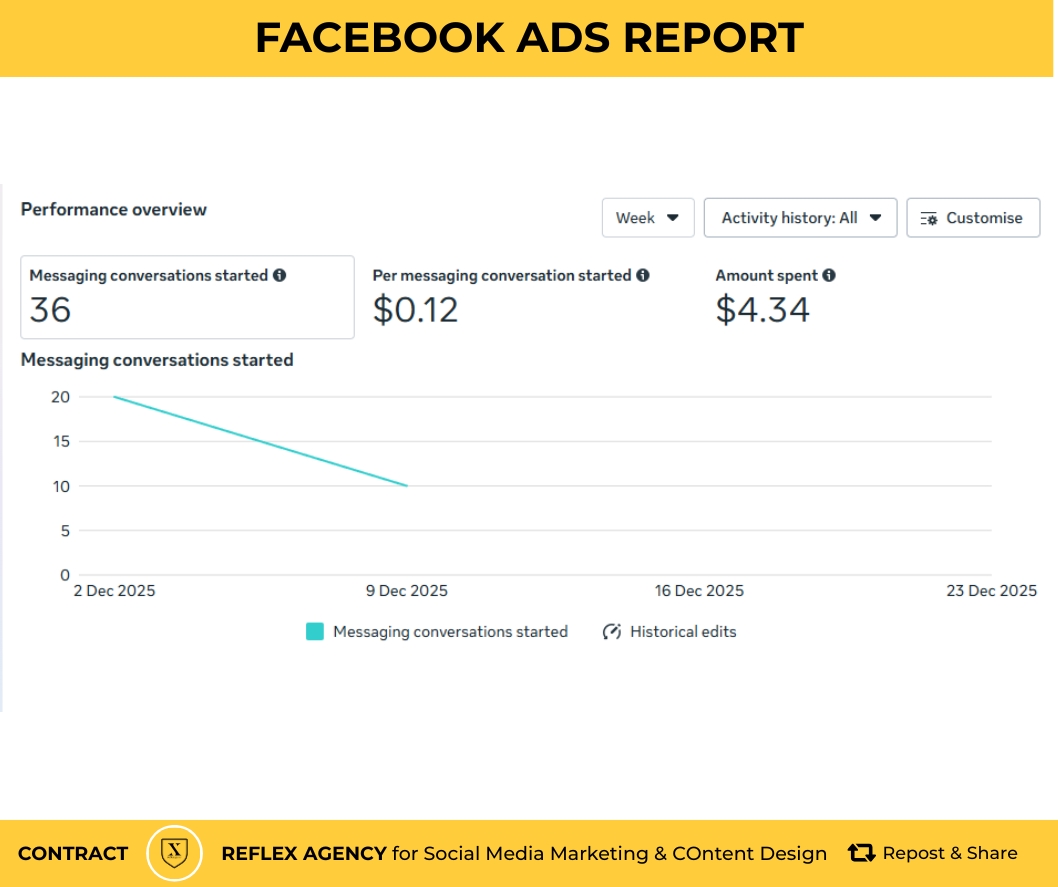
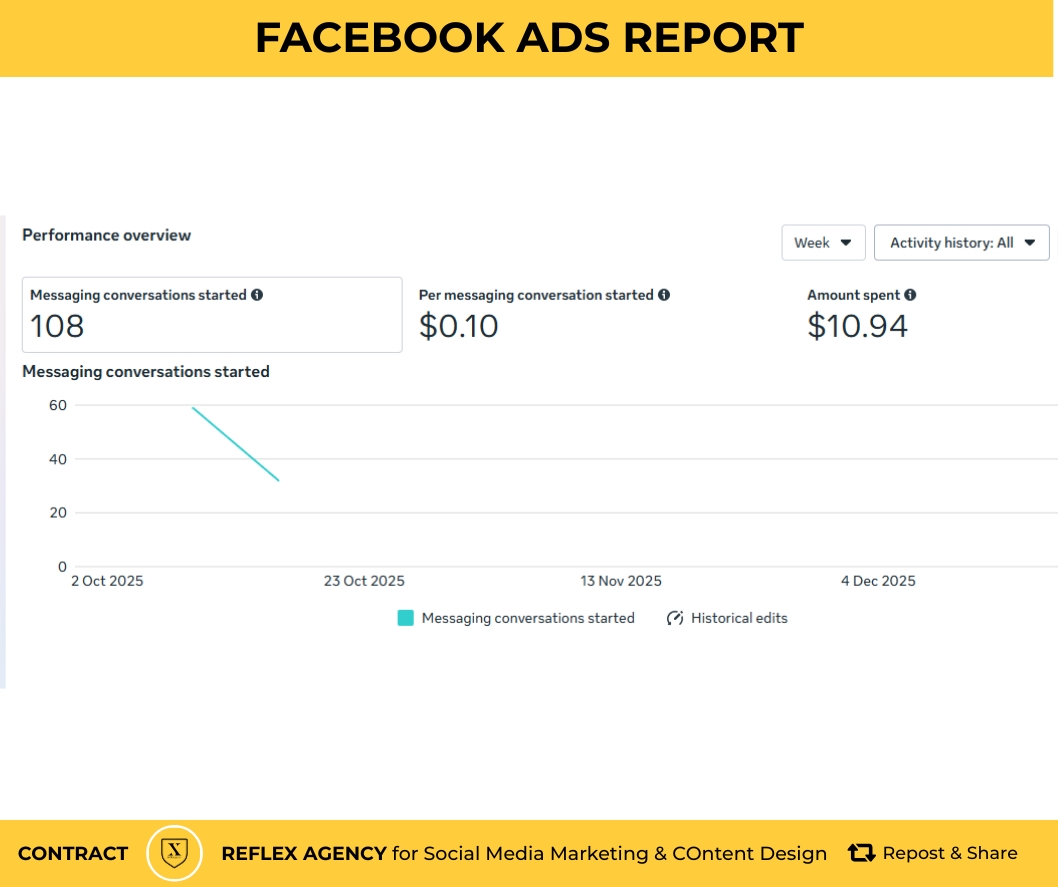
- Messaging Conversations Started: This counts how many times a new, two-way conversation began in a messaging app (Messenger, Instagram, or WhatsApp) after a user clicked your ad. It excludes users who have messaged your business in the past.
- Cost Per Messaging Conversation Started: Calculated as your total spend divided by the number of new conversations started. This reflects the cost-efficiency of direct customer acquisition.
- Historical Edits: A log of all modifications made to your account, including changes to budgets, targeting, schedules, and creative elements. These logs are crucial for identifying which specific changes led to performance improvements or declines.
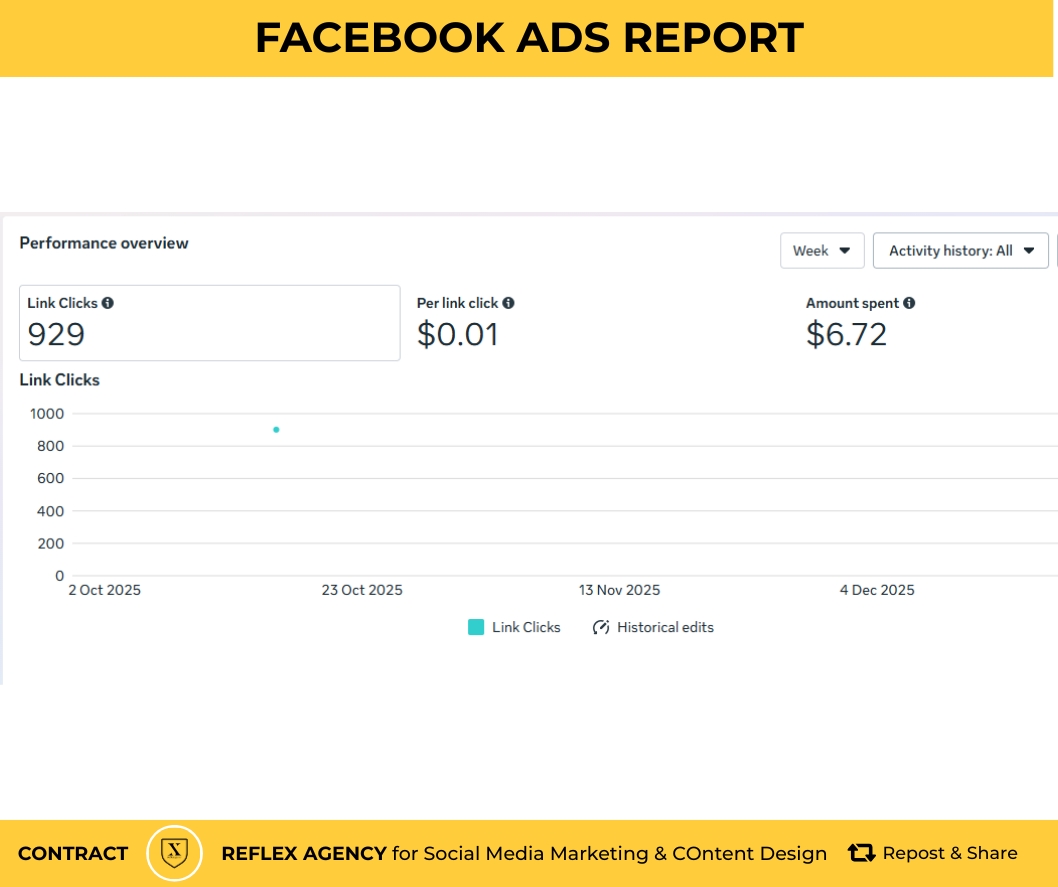
- CTR (Click-Through Rate): The percentage of people who clicked your ad after seeing it. It is a primary indicator of how relevant your creative and audience targeting are to each other.
2. Global Advertising Benchmarks (2025–2026)
The following benchmarks represent average performance across all industries as of late 2025 and 2026:
| Metric | Average / Median | High Performance (Top 25%) |
| CPC (Cost Per Click) | $0.58 – $0.94 | Under $0.40 |
| CPM (Cost Per 1,000 Impressions) | $8.96 – $16.06 | Under $5.00 |
| CPL (Cost Per Lead) | $18.75 – $41.46 | Under $8.68 |
| CTR (Click-Through Rate) | 0.90% – 1.71% | 5.00%+ |
| ROAS (Return on Ad Spend) | 2.50x – 4.00x | 4.50x+ |
3. Performance Factors & Trends
- Seasonality: Ad costs typically peak in October and November during the holiday shopping season and see a sharp correction or “cooldown” in December and January.
- Industry Variation: High-competition sectors like Finance and Insurance see much higher costs, with average CPCs reaching $3.77. Conversely, Shopping and Retail enjoy lower costs, often around $0.34 – $0.70.
- Creative Formats: Vertical, mobile-friendly video formats like Reels and Stories are currently dominant, generating an average of 12% more conversions than standard formats.
- AI Optimization: Using Advantage+ tools allows the Meta algorithm to find the cheapest conversion opportunities across broader audiences.


