This Facebook Ads report analysis details key performance metrics, conversion types, and comparative benchmarks for campaigns in late 2025 and 2026.
Facebook Ads Performance Breakdown
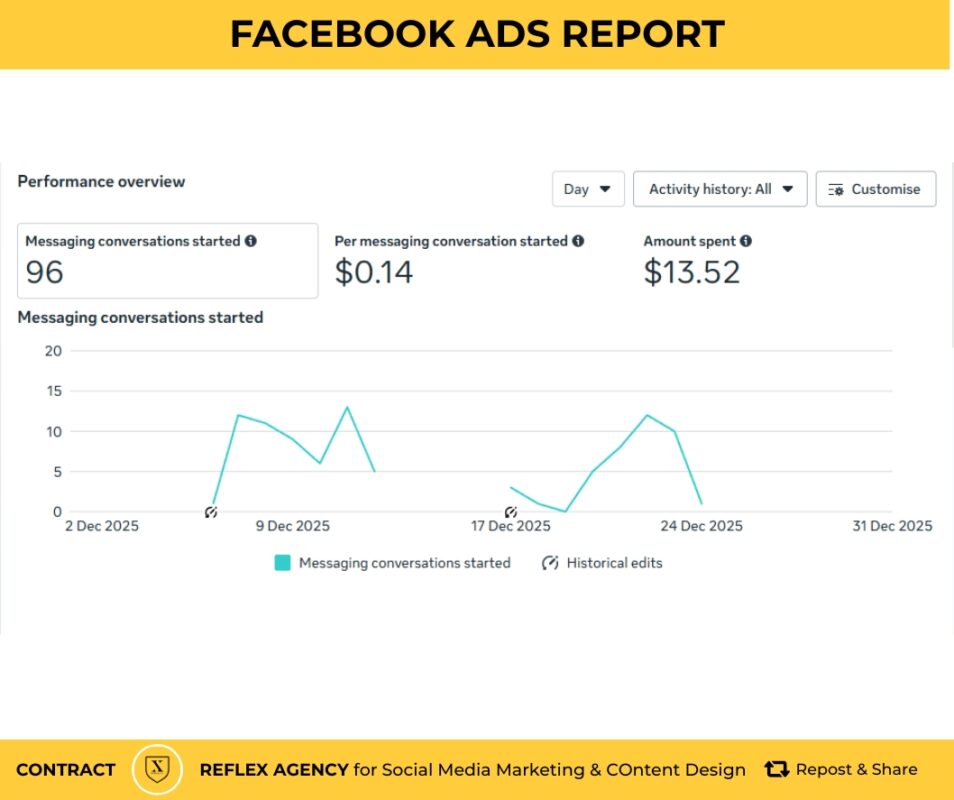
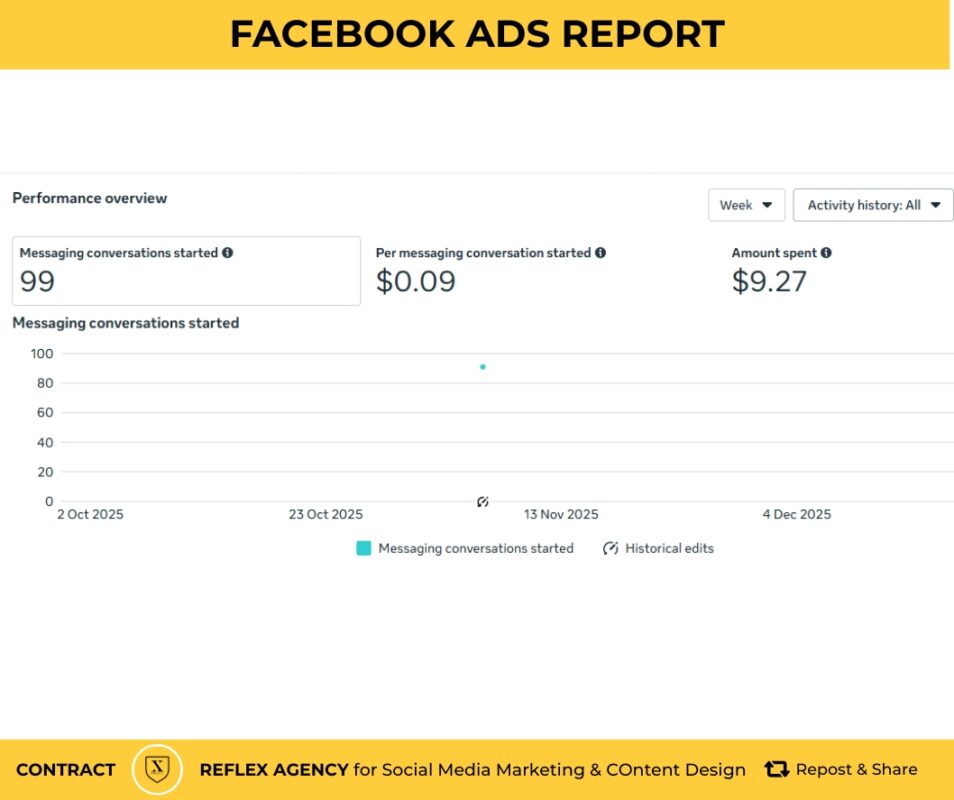
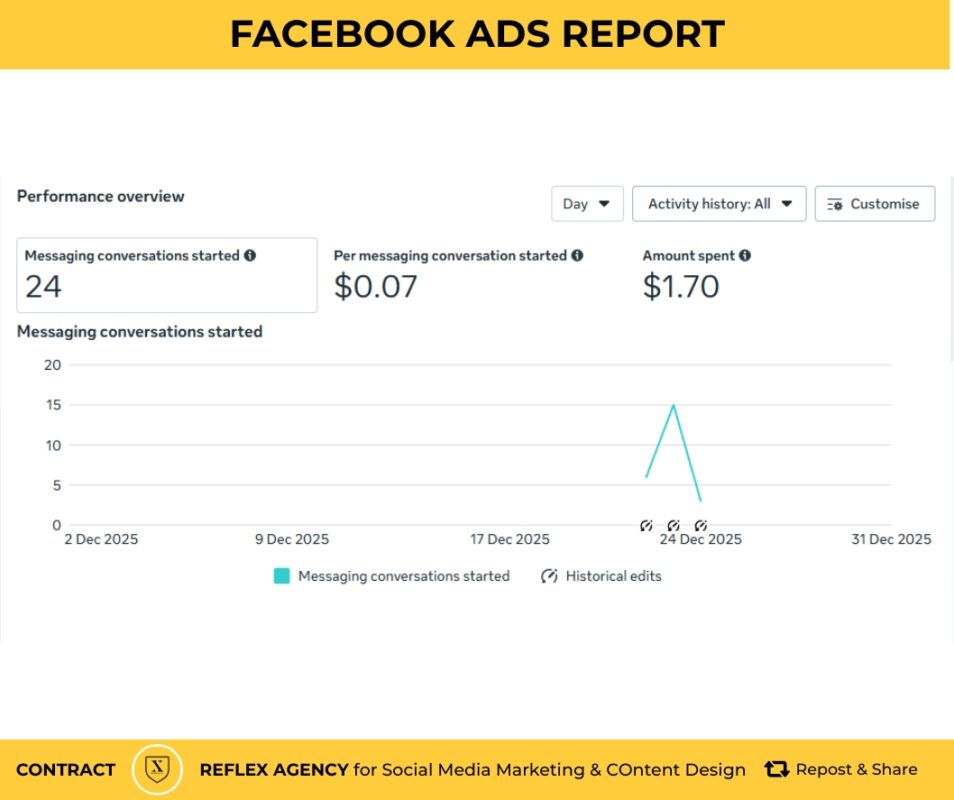
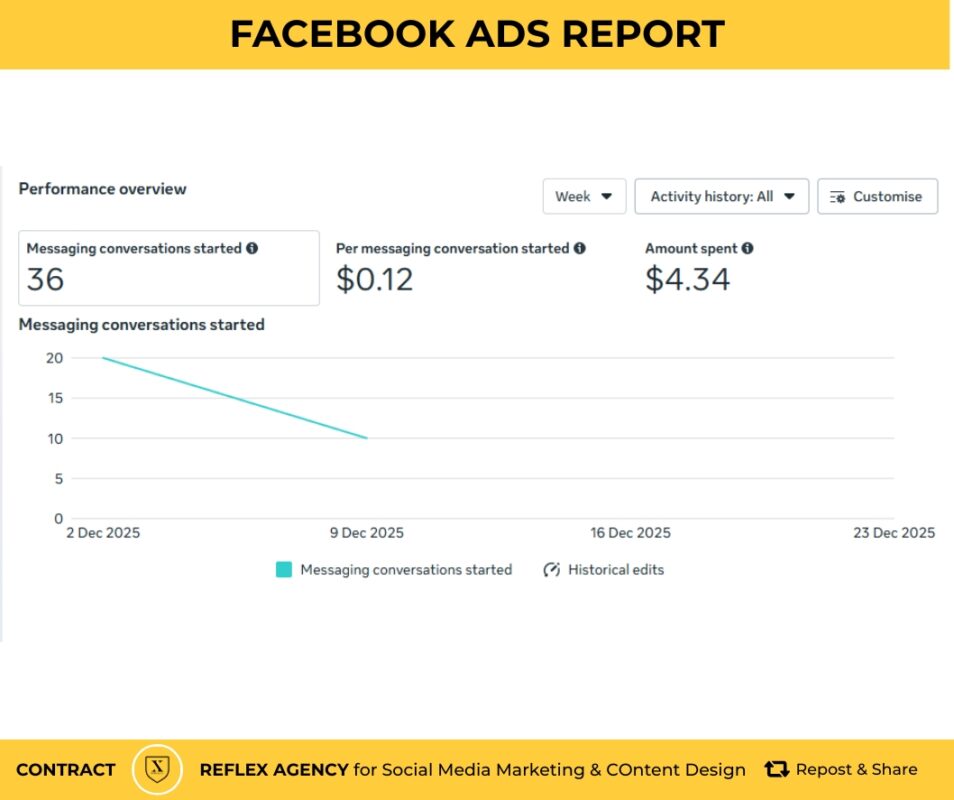
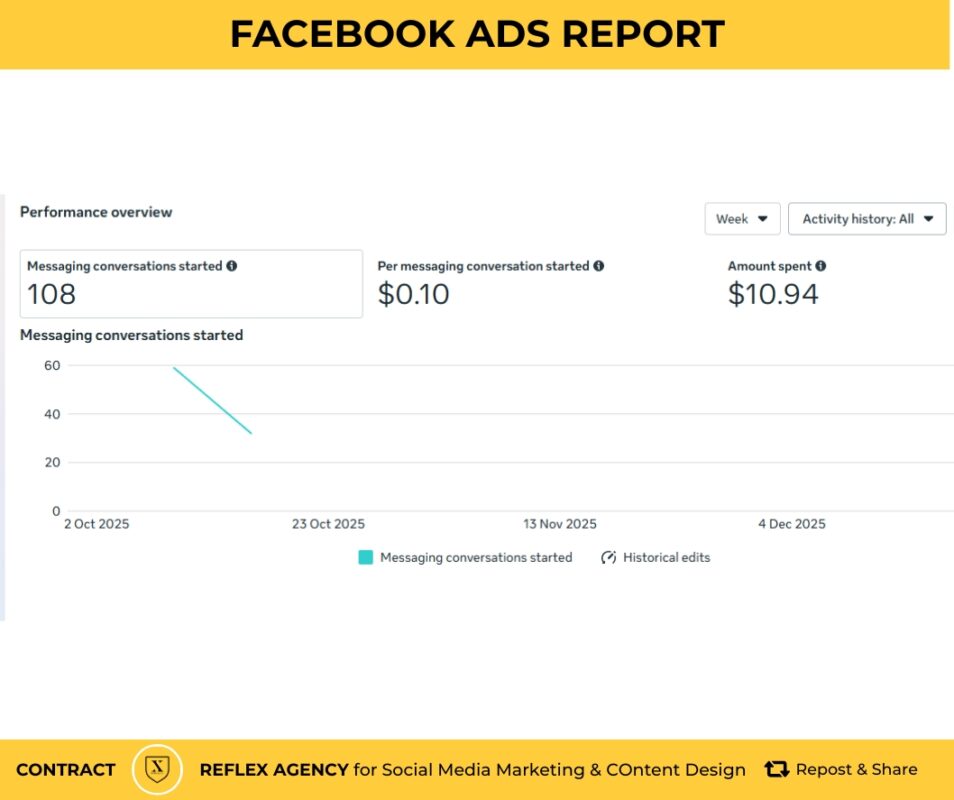
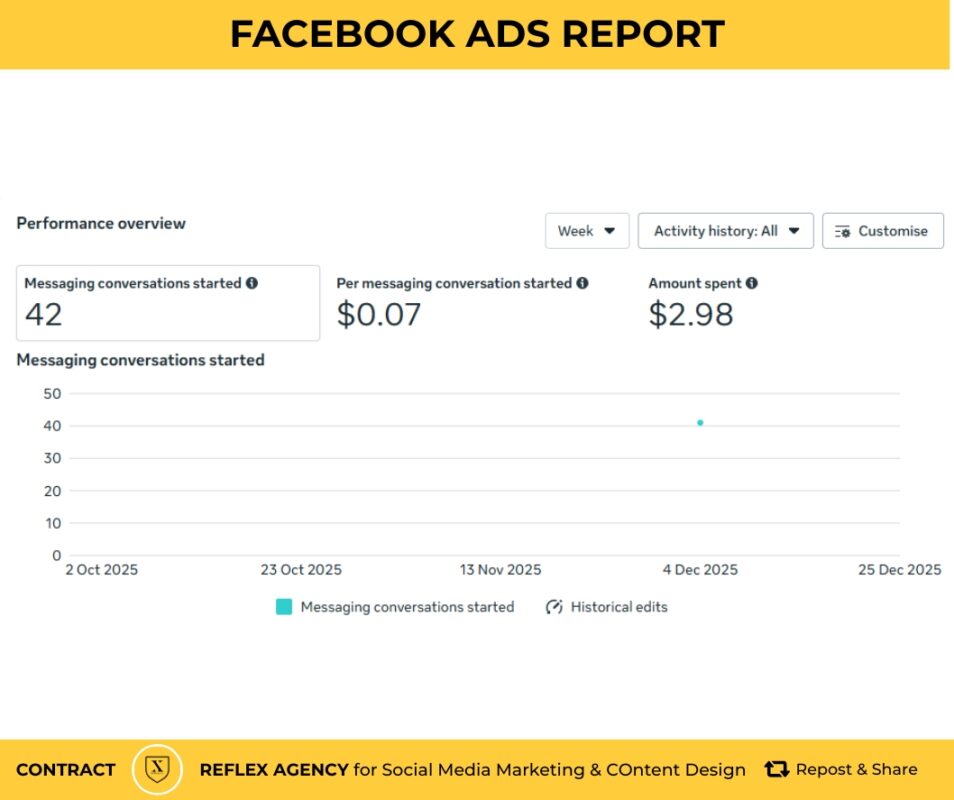
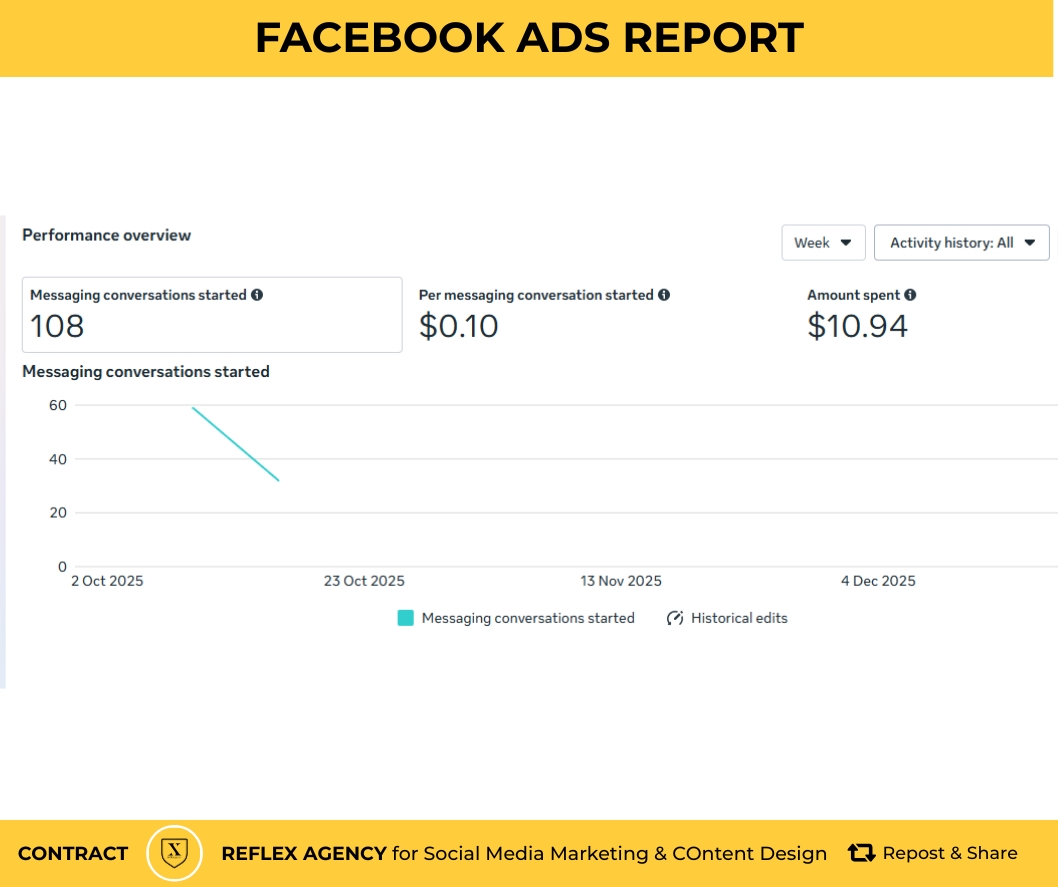
Based on recent data, your messaging-focused campaigns have achieved high cost-efficiency.
| Metric | Recent Performance | 2025 Peer Median |
| Messaging Conversations Started | 42 – 96 | Varies by Budget |
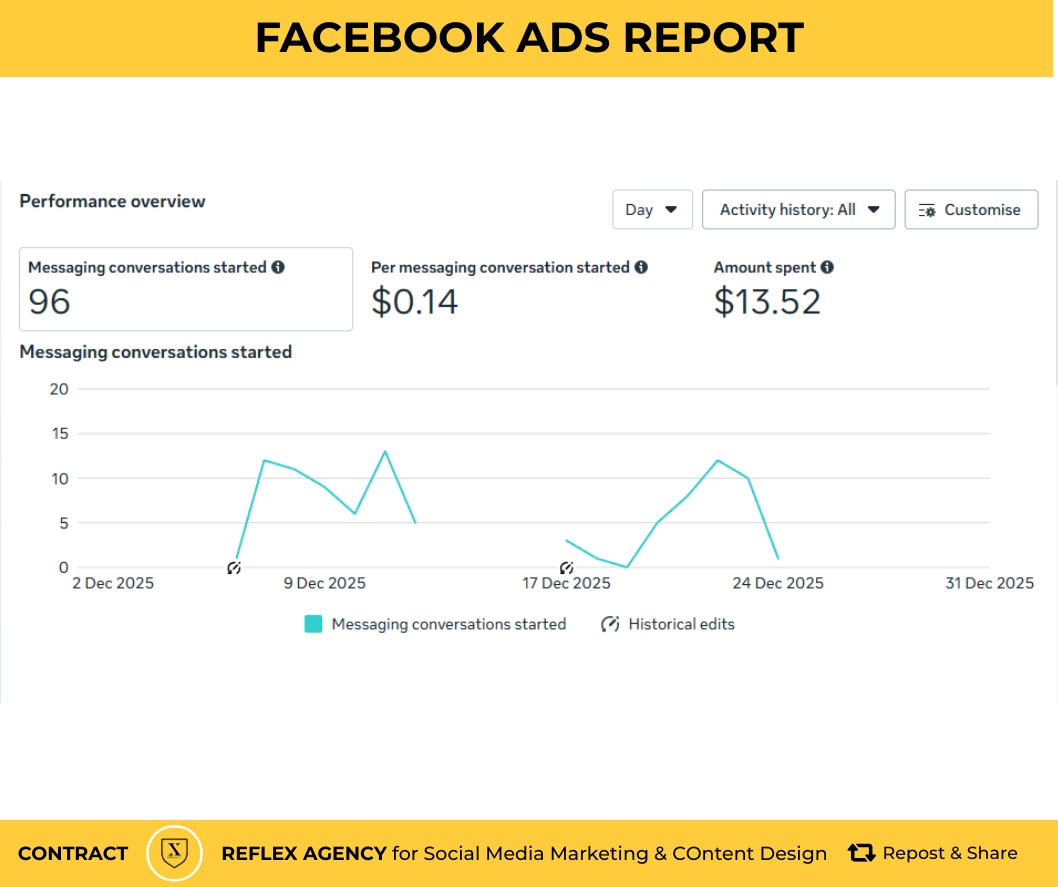
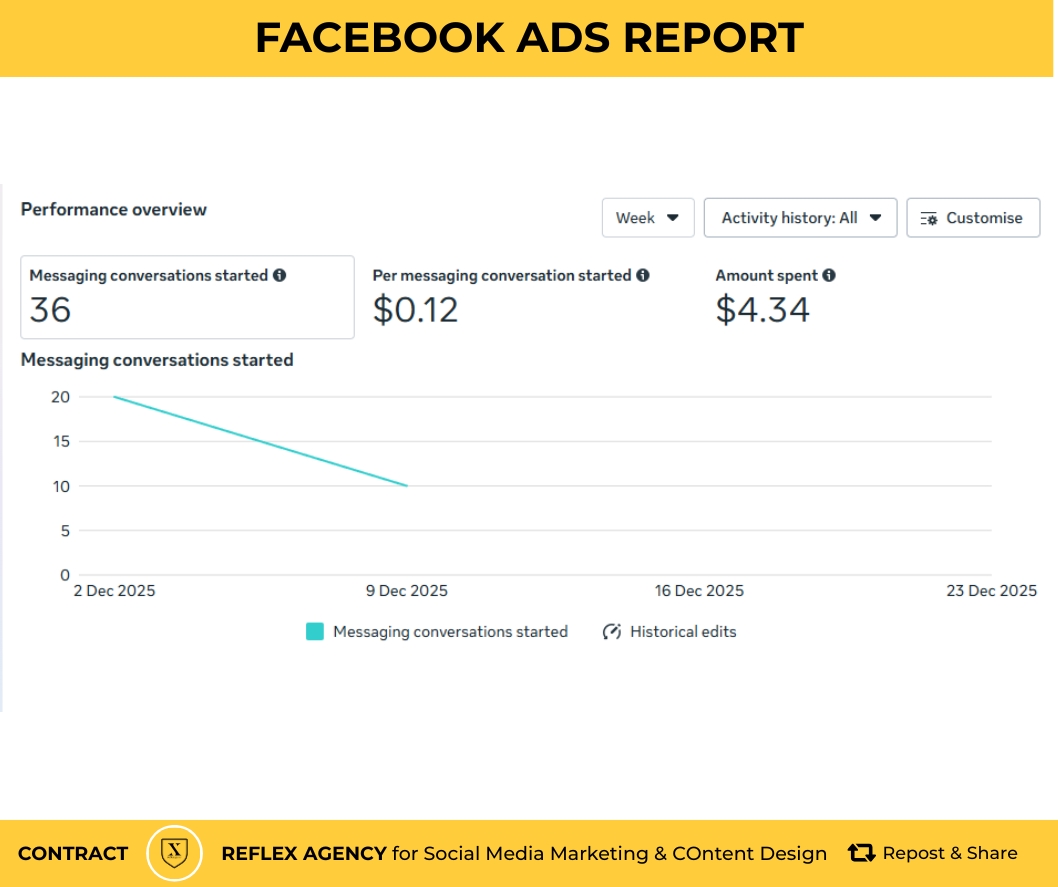
| Cost Per Conversation Started | $0.07 – $0.14 | $0.10 |
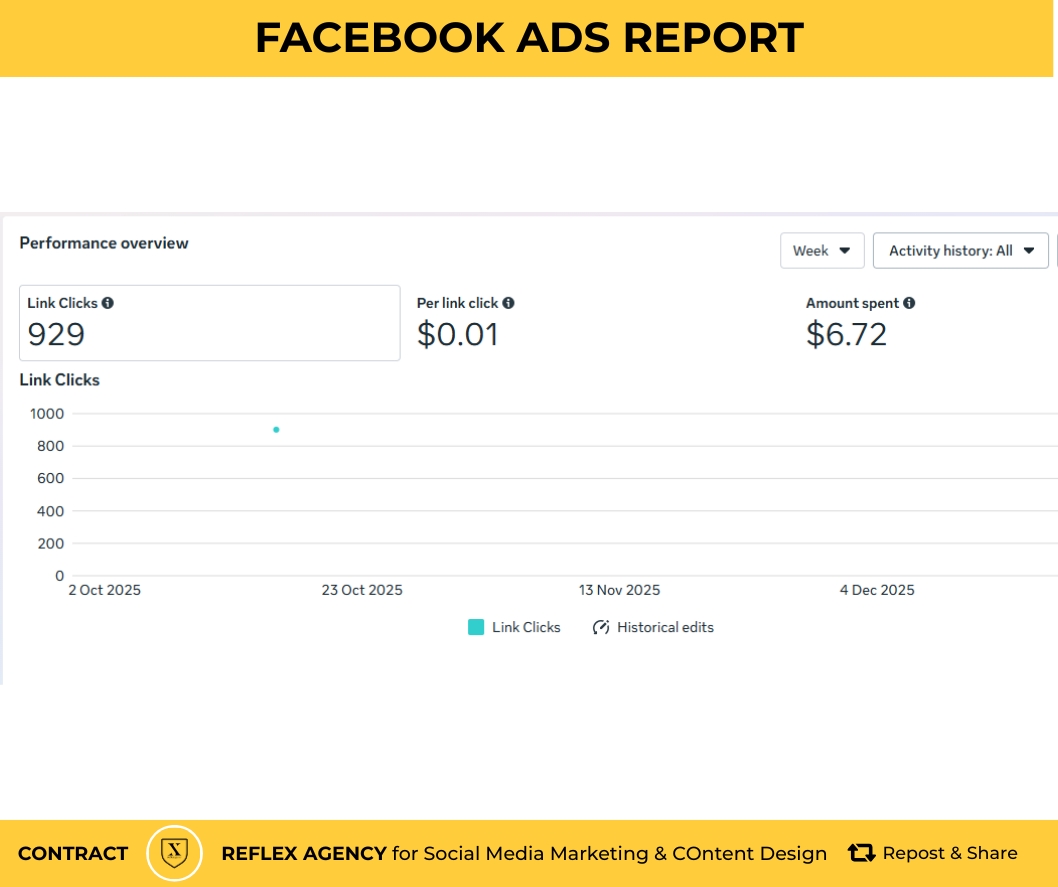
| Average CPC (Cost Per Click) | N/A | $0.70 – $0.82 |
| Average CTR (Click-Through Rate) | N/A | 0.90% – 1.60% |
Key Metrics & Reporting Definitions
- Messaging Conversations Started: This metric counts the total number of new conversations initiated between your brand and audience, typically through platforms like Messenger, Instagram, or WhatsApp, after they saw or clicked your ad.
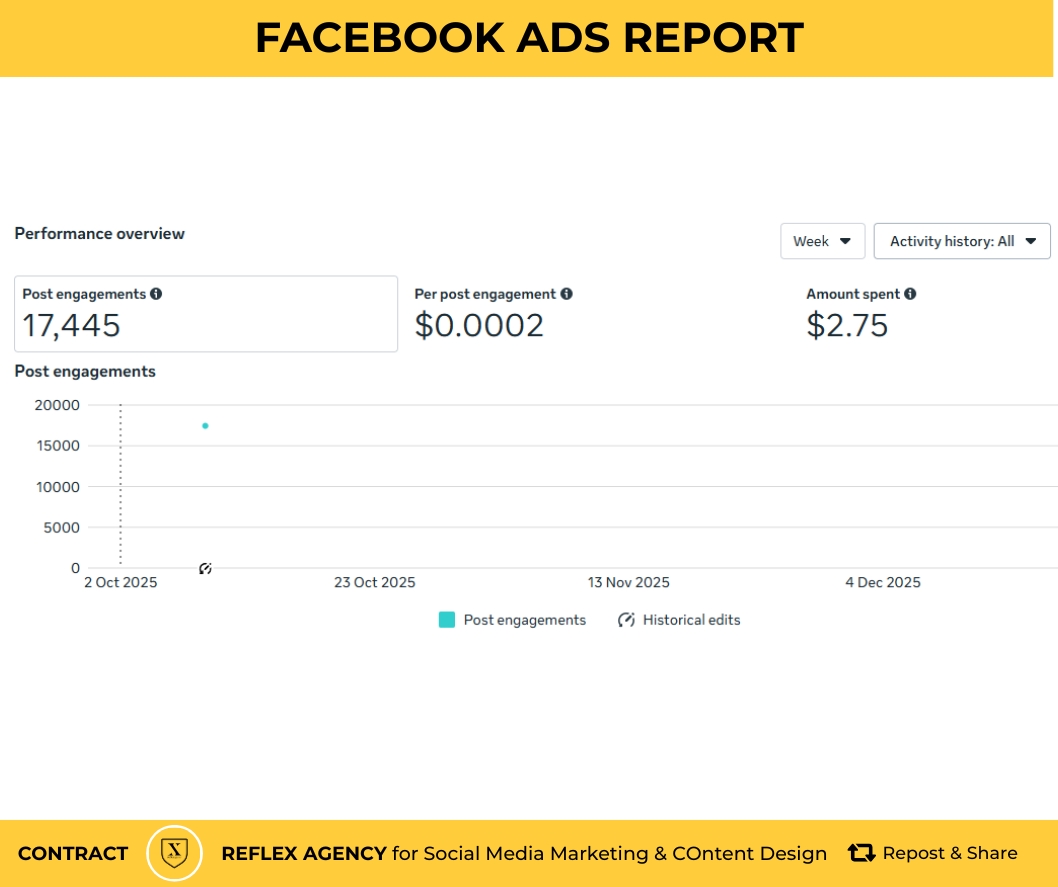
- Historical Edits: These represent a log of all modifications—such as changes to targeting, creative, or budget—made to your campaigns. Analyzing these edits against performance shifts helps identify which specific adjustments led to result fluctuations.
- Cost Efficiency: A cost of $0.07 per conversation is highly efficient, beating the 2025 peer median of $0.10. Previous results showed a cost of $0.14, which was 41% higher than similar ad sets at that time.
- Activity Gaps: Performance charts often show periods with zero results, which usually indicates the campaign was paused, the budget was exhausted, or there were delivery issues during those dates.
2026 Industry Benchmarks
If your objectives expand beyond messaging, standard 2026 ranges include:
- Cost Per Click (CPC): The platform average for traffic-focused ads is approximately $0.70.
- Cost Per Lead (CPL): Average lead generation costs are roughly $27.66, though competitive sectors like Finance can exceed $55.00.
- Click-Through Rate (CTR): An average CTR for traffic campaigns is 1.57% – 1.71%. Anything above 2.50% is considered a top-tier performer.
Optimization Insights
- Creative Fatigue: High frequency (the average number of times one person sees your ad) can lead to “ad fatigue,” causing performance to decline over time.
- AI-Driven Tools: Using Advantage+ placements allows the Meta algorithm to automatically find the best-performing locations for your ads (e.g., Reels, Stories, or Feed).
- Seasonality: Ad costs typically peak in December (Q4) due to high competition and often reach their lowest point in January.


