Based on current data for late 2025 and early 2026, Facebook advertising costs are influenced by the specific objective of your campaign and the industry you are in.
Average Facebook Ad Benchmarks (2025–2026)
General performance across all industries shows the following typical ranges:
| Metric | Average / Median | High Performance (Top 25%) |
| CPC (Cost Per Click) | $0.62 – $1.13 | Under $0.40 |
| CPM (Cost Per 1,000 Impressions) | $11.62 – $13.57 | Under $5.00 |
| CTR (Click-Through Rate) | 0.90% – 1.60% | 2.50%+ |
| CPL (Cost Per Lead) | $10.17 – $27.66 | Under $8.68 |
Cost by Campaign Objective
The “result” you prioritize significantly impacts your cost per action:
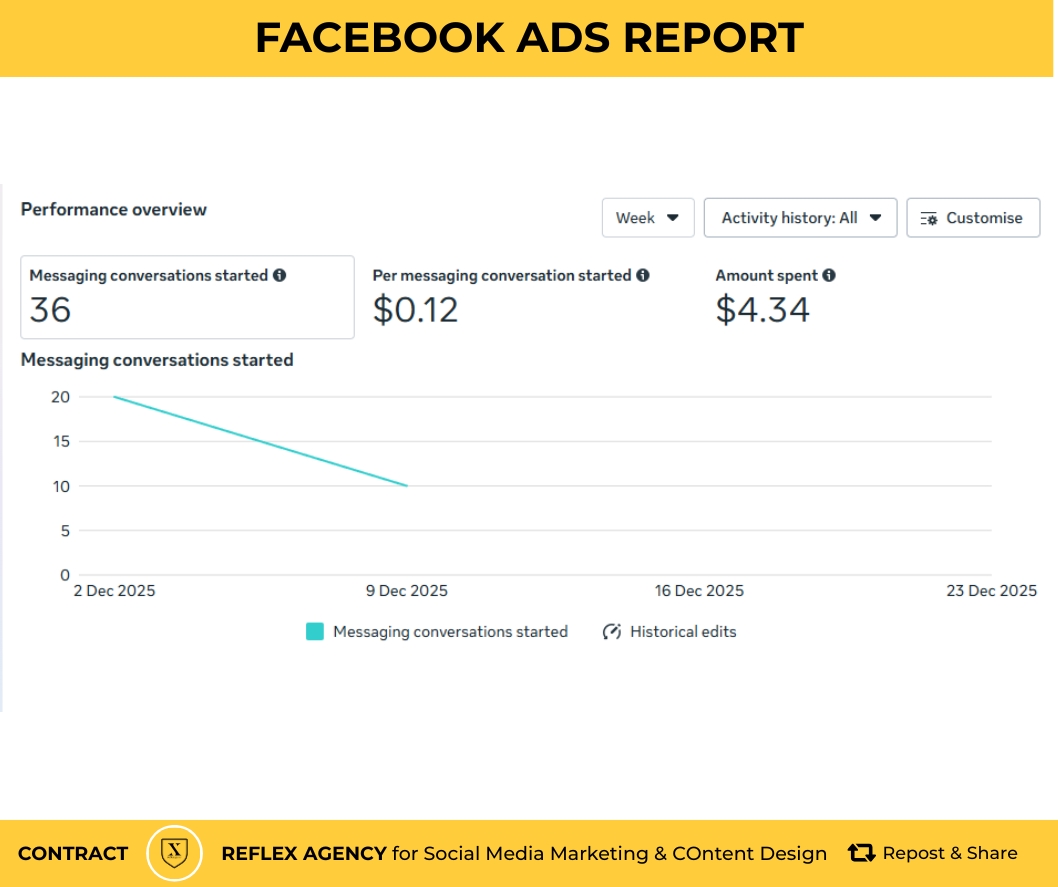
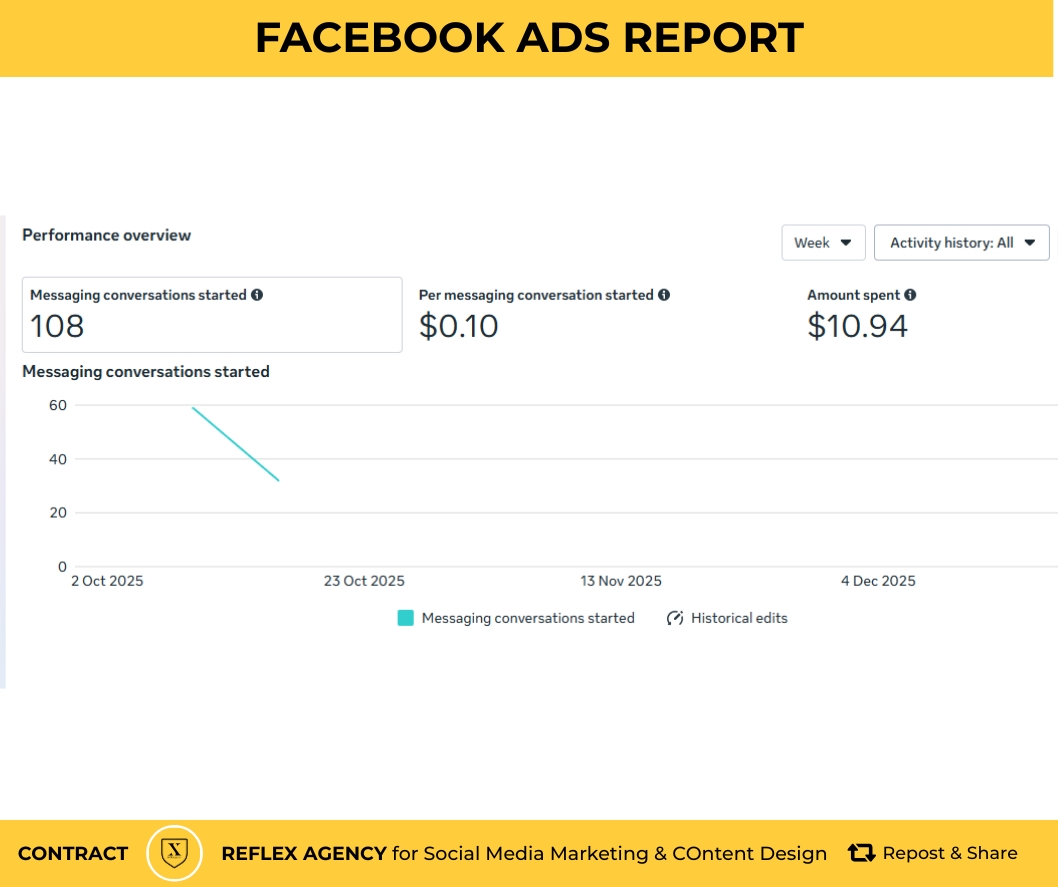
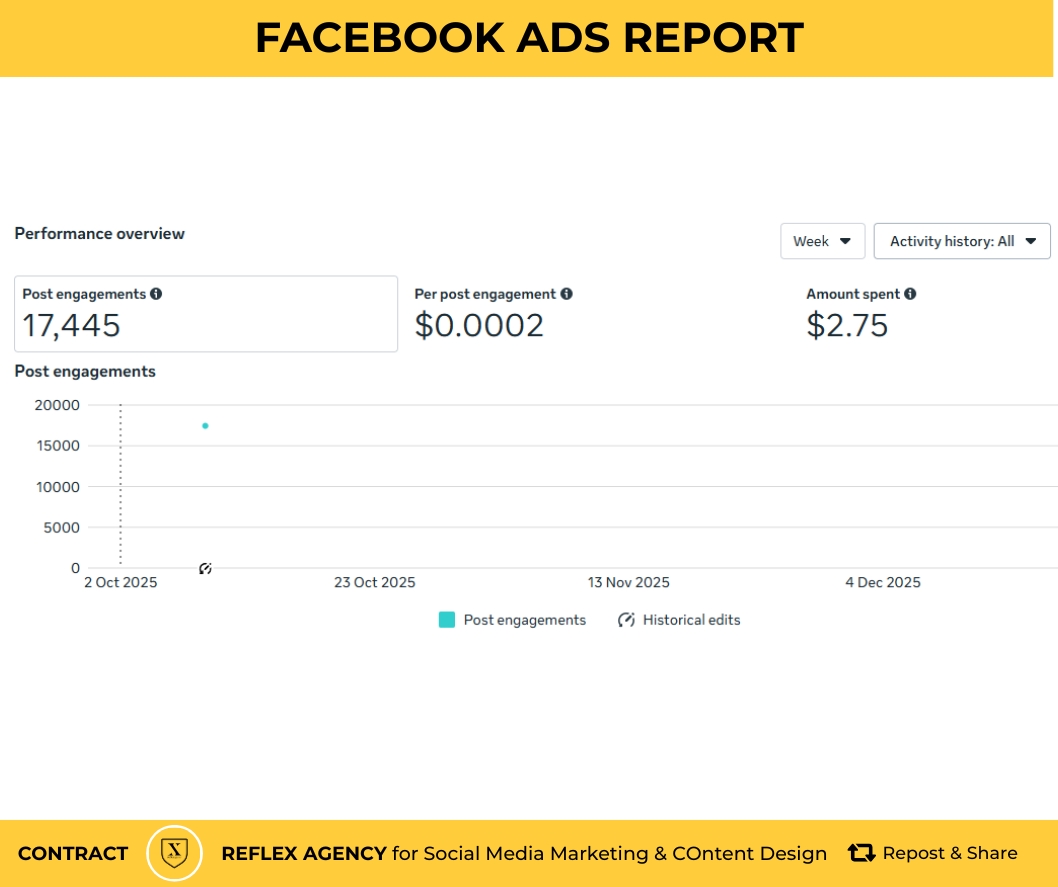
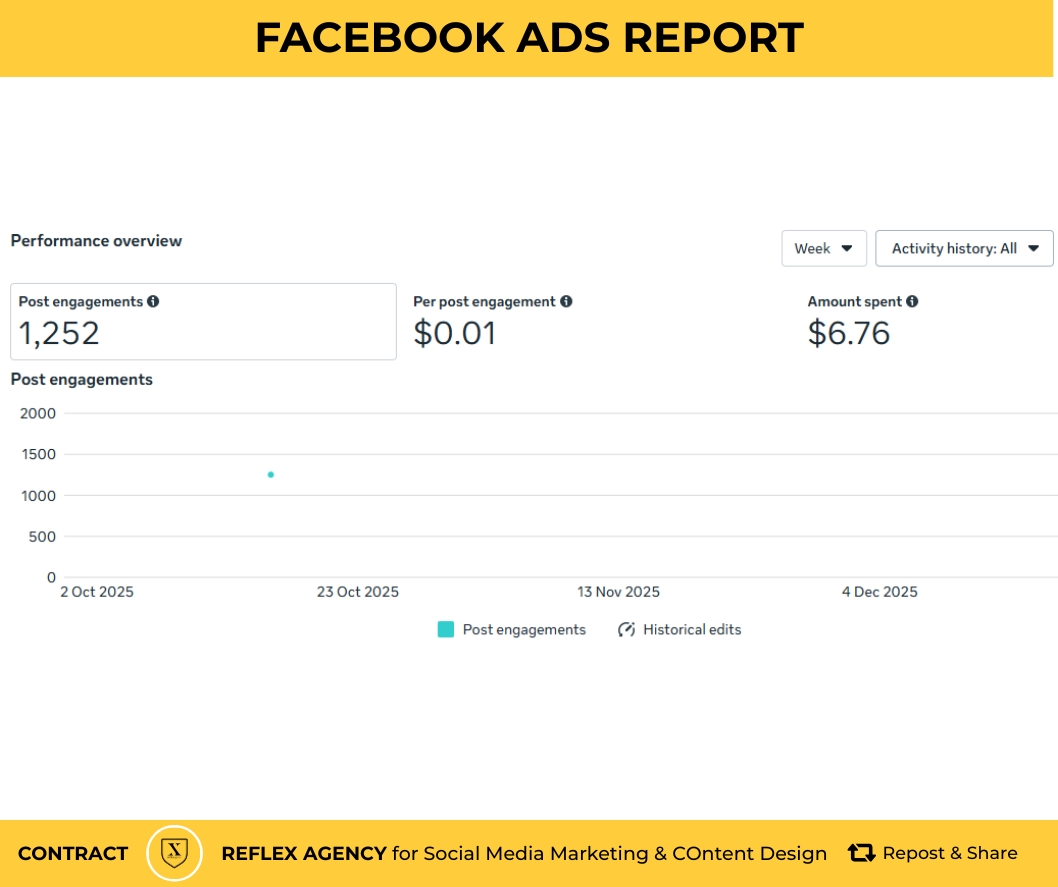
- Messaging & Engagement: Generally the most cost-efficient, with costs per engagement often ranging between $0.01 and $0.25.
- Traffic: Average cost per click for traffic campaigns is approximately $0.70.
- Conversions/Sales: These carry the highest cost but offer the highest intent, with average costs per action ranging from $8.00 to $55.00 depending on the specific product and industry.
Industry-Specific Highlights
Costs vary widely based on competition levels and customer lifetime value:
- Retail & Apparel: Enjoy some of the lowest costs, with CPCs averaging around $0.45 – $0.70.
- Finance & Insurance: Experience the highest costs, with CPCs often exceeding $3.70 and CPMs reaching $22.50 in some B2B sectors.
- Real Estate: Sees average costs per lead around $16.61, which is relatively low compared to the industry’s high conversion values.
Factors Influencing Your 2026 Costs
- Ad Relevance & Quality: Meta rewards high-quality ads with lower costs. High engagement rates can reduce your CPM by making your ads more valuable to users.
- AI Adoption: Using Advantage+ campaigns is now a standard practice that helps the algorithm find more cost-efficient opportunities through broad targeting.
- Seasonality: Costs peak significantly in Q4 (October–December) due to holiday competition, while January often offers the lowest costs of the year.


