Based on the most recent 2025 and 2026 data for Facebook advertising, performance benchmarks are highly dependent on your specific campaign objective and industry.
2026 Facebook Ads Benchmarks
The following are the median performance metrics currently observed across the platform:
| Metric | Average / Median | Good / Top 25% |
| CPC (Cost Per Click) | $0.70 – $0.82 | Under $0.40 |
| CPM (Cost Per 1,000 Impressions) | $11.62 – $13.57 | Under $5.00 |
| CPL (Cost Per Lead) | $10.17 – $19.68 | Under $8.68 |
| CTR (Click-Through Rate) | 0.90% – 1.60% | 2.50%+ |
| ROAS (Return on Ad Spend) | 2.19x – 2.79x | 4.50x+ |
The “result” you are optimizing for dictates your cost structure:
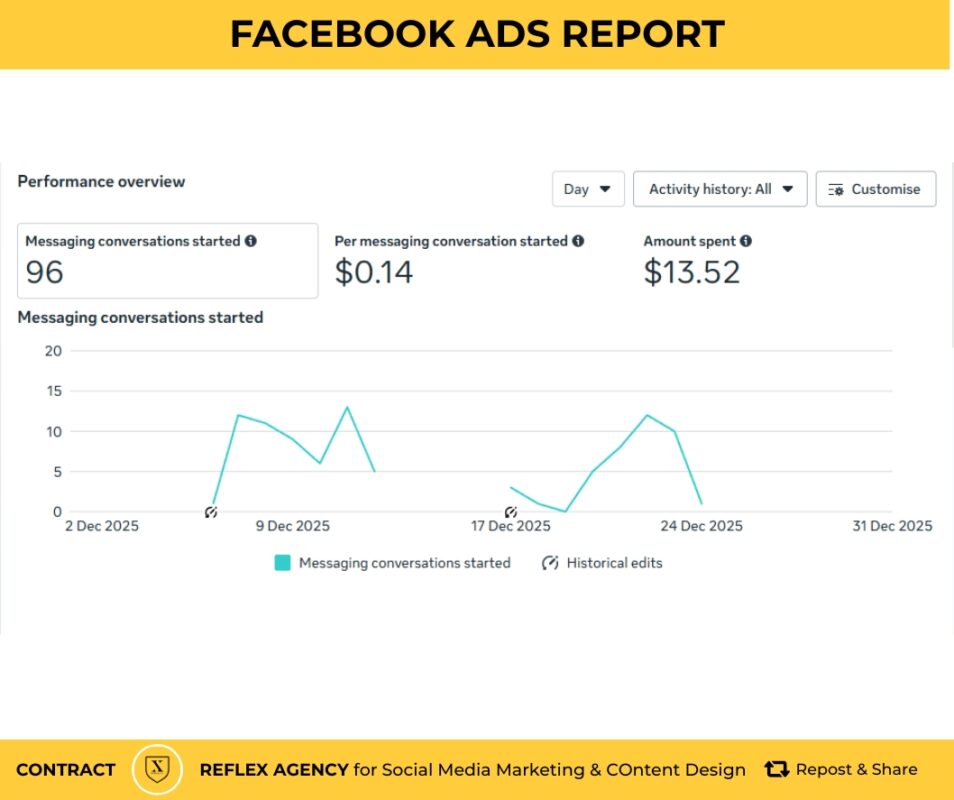
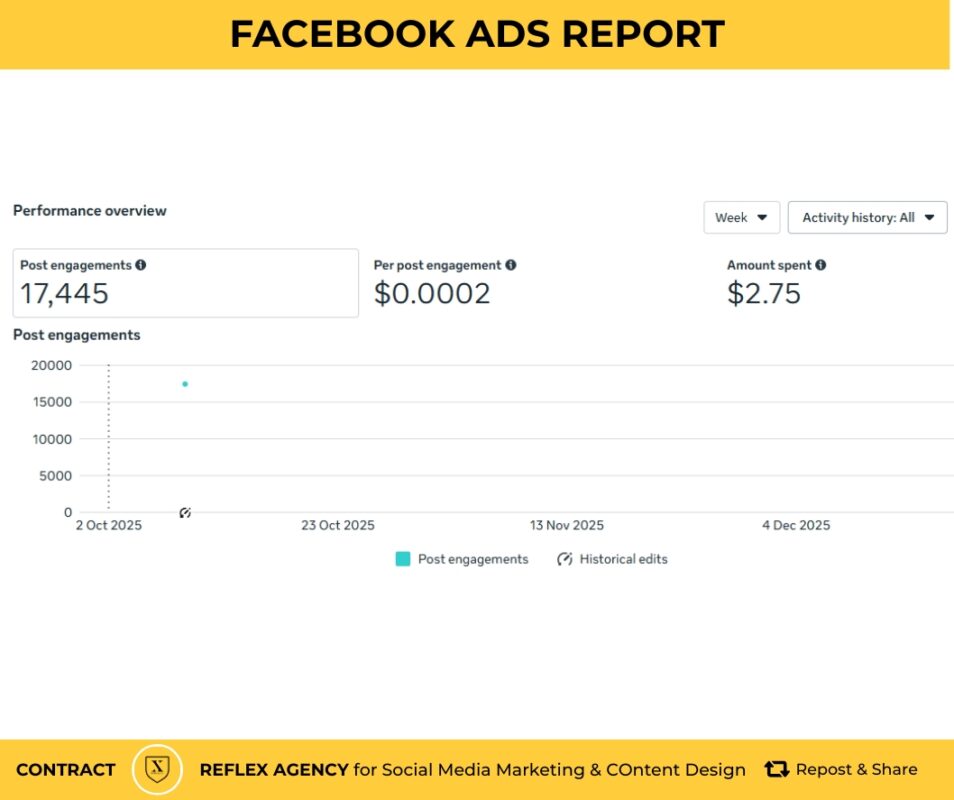
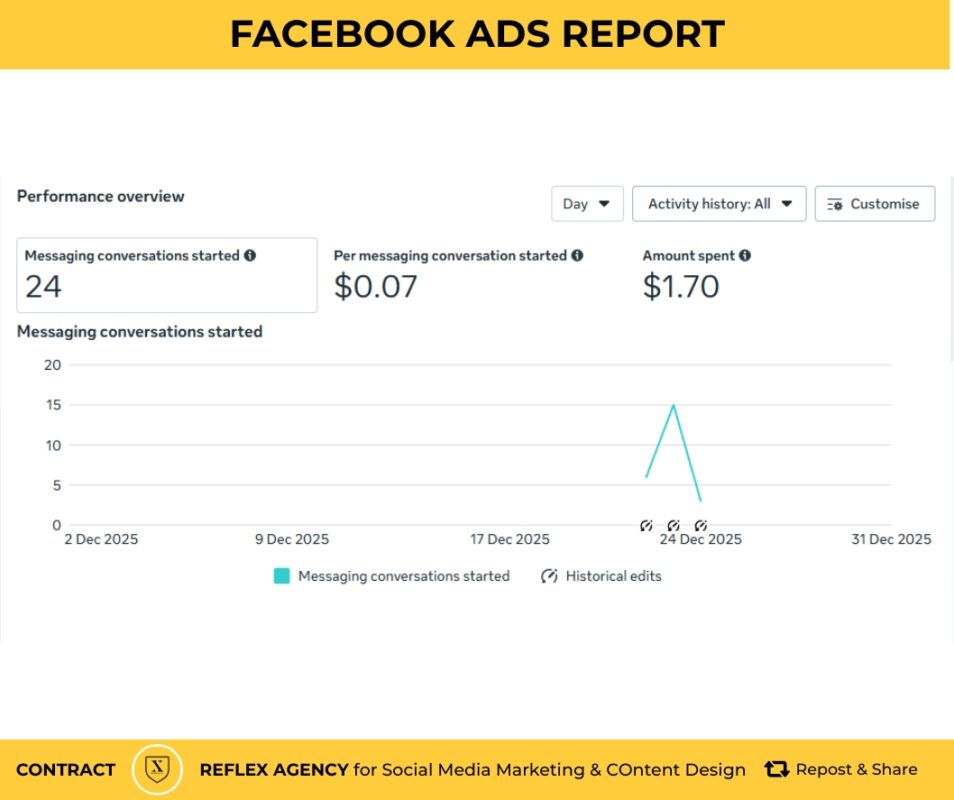
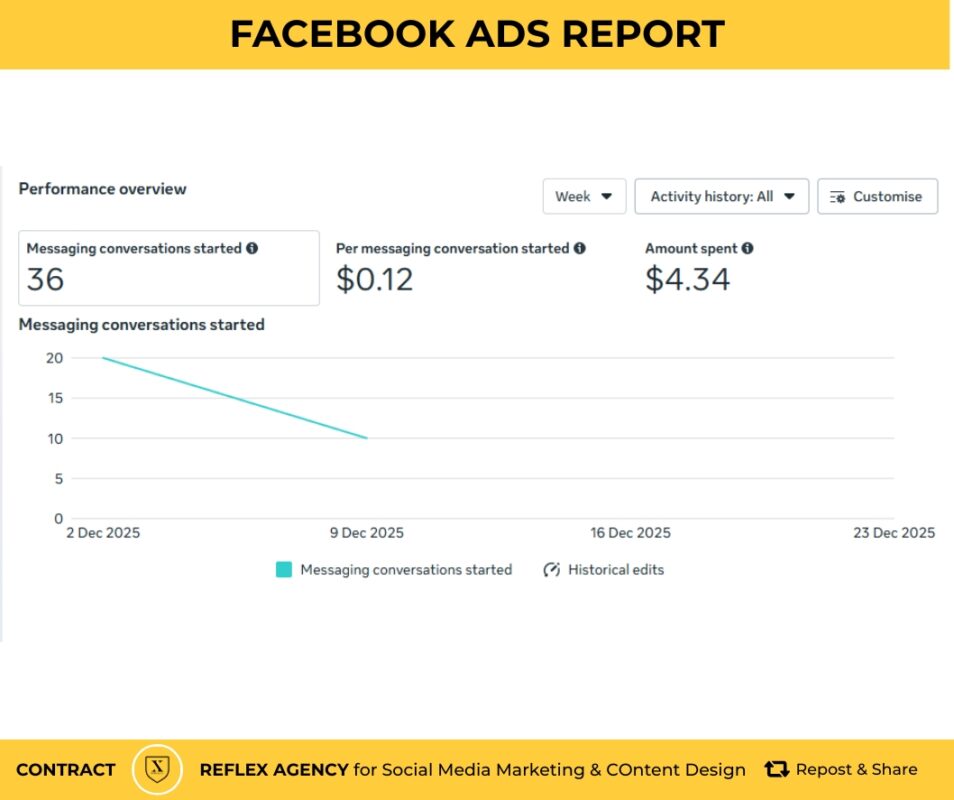
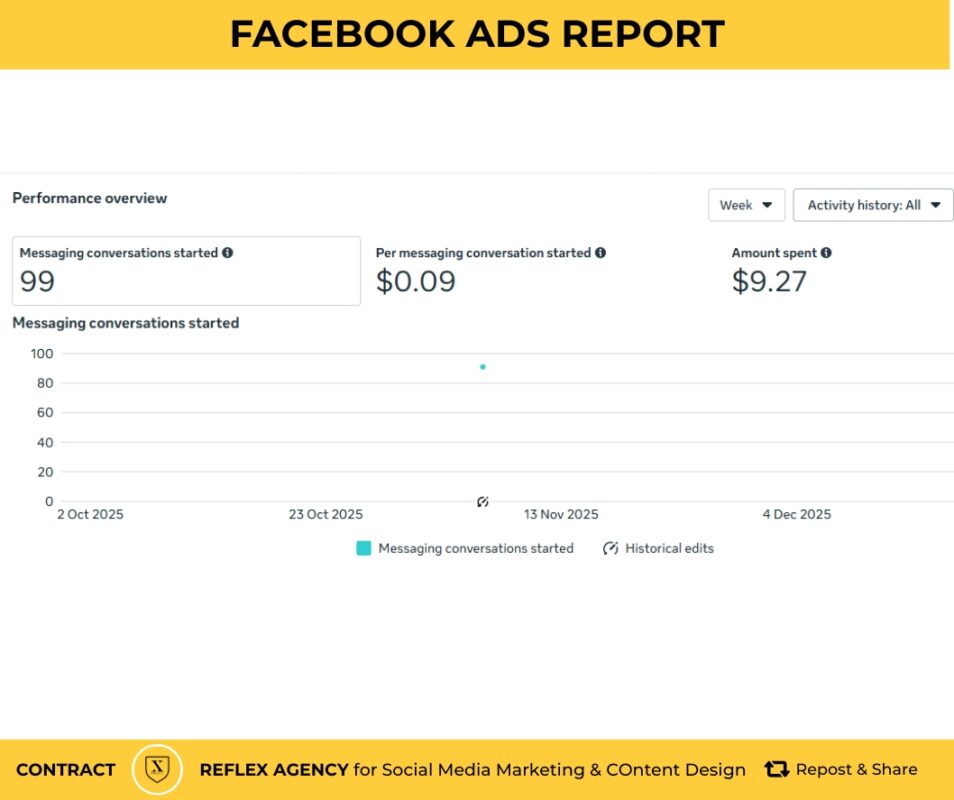
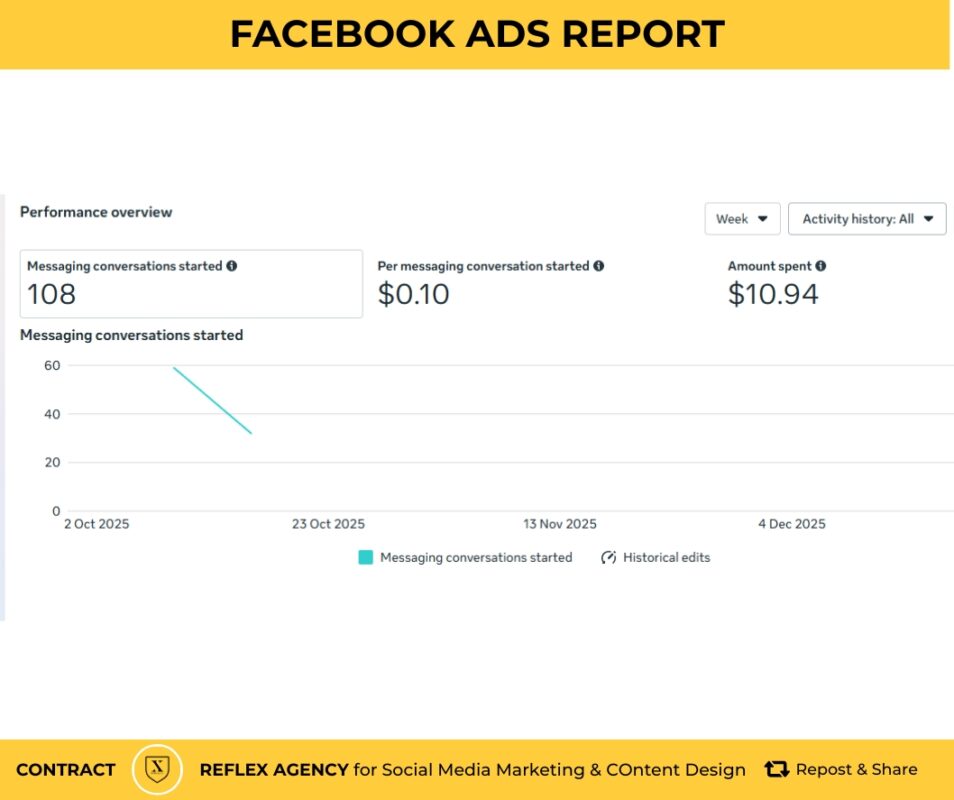
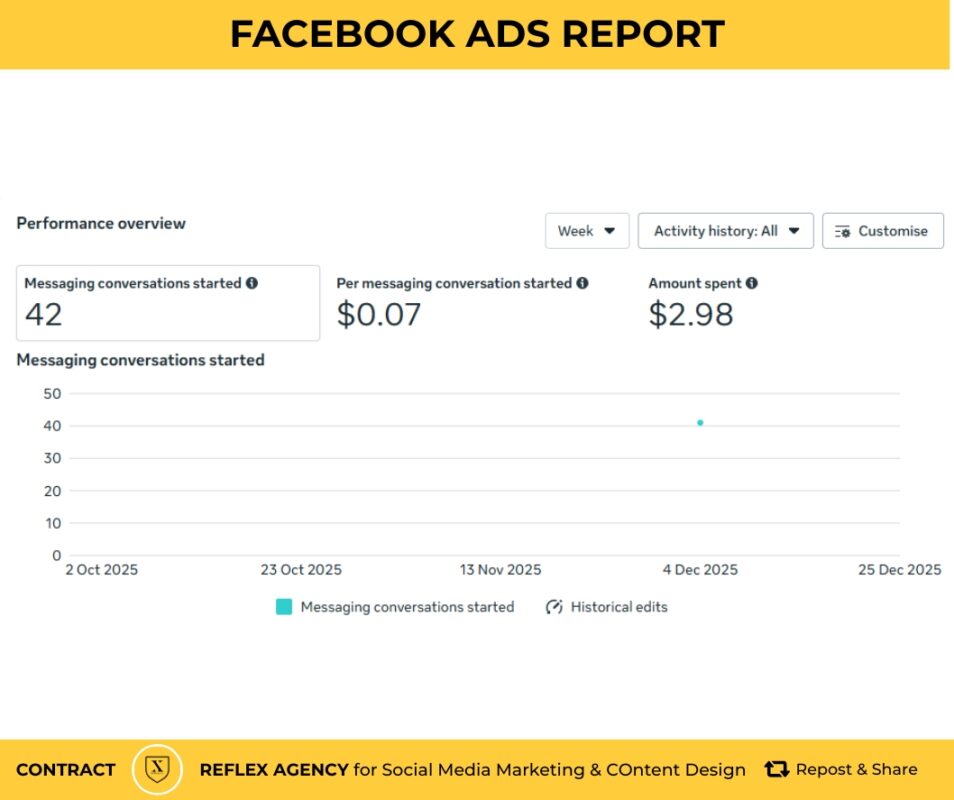
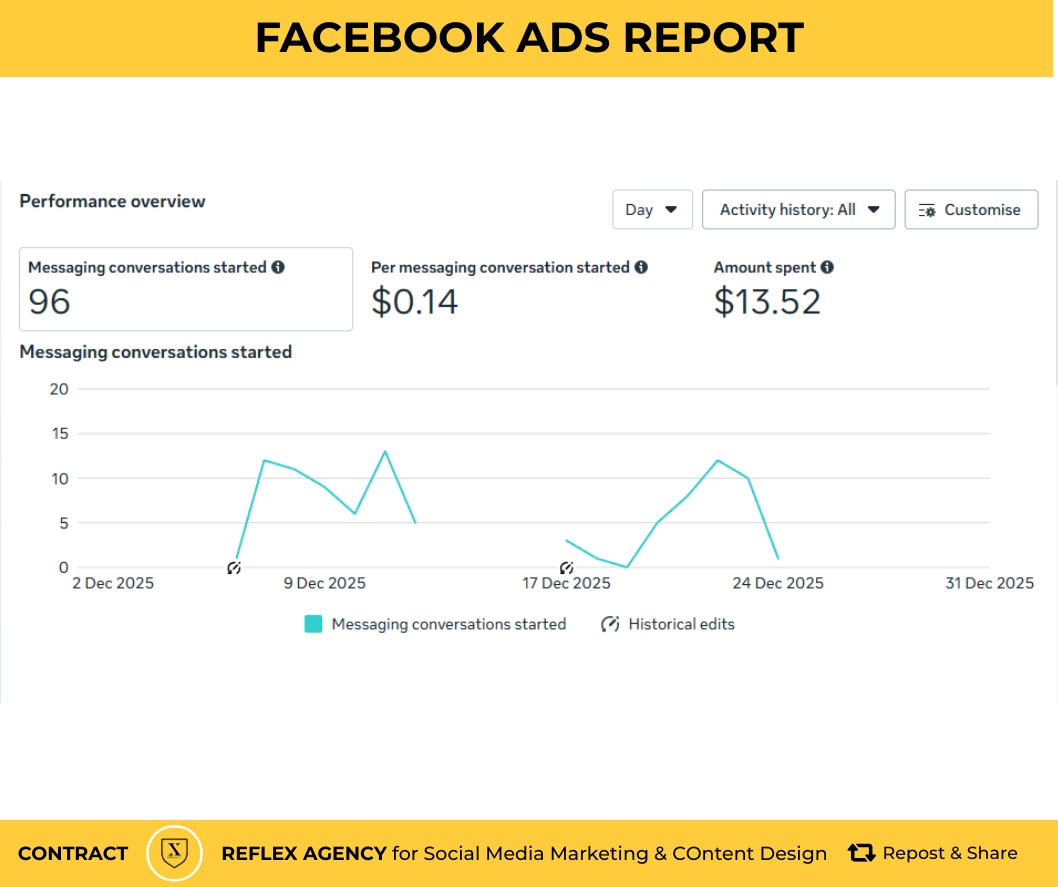
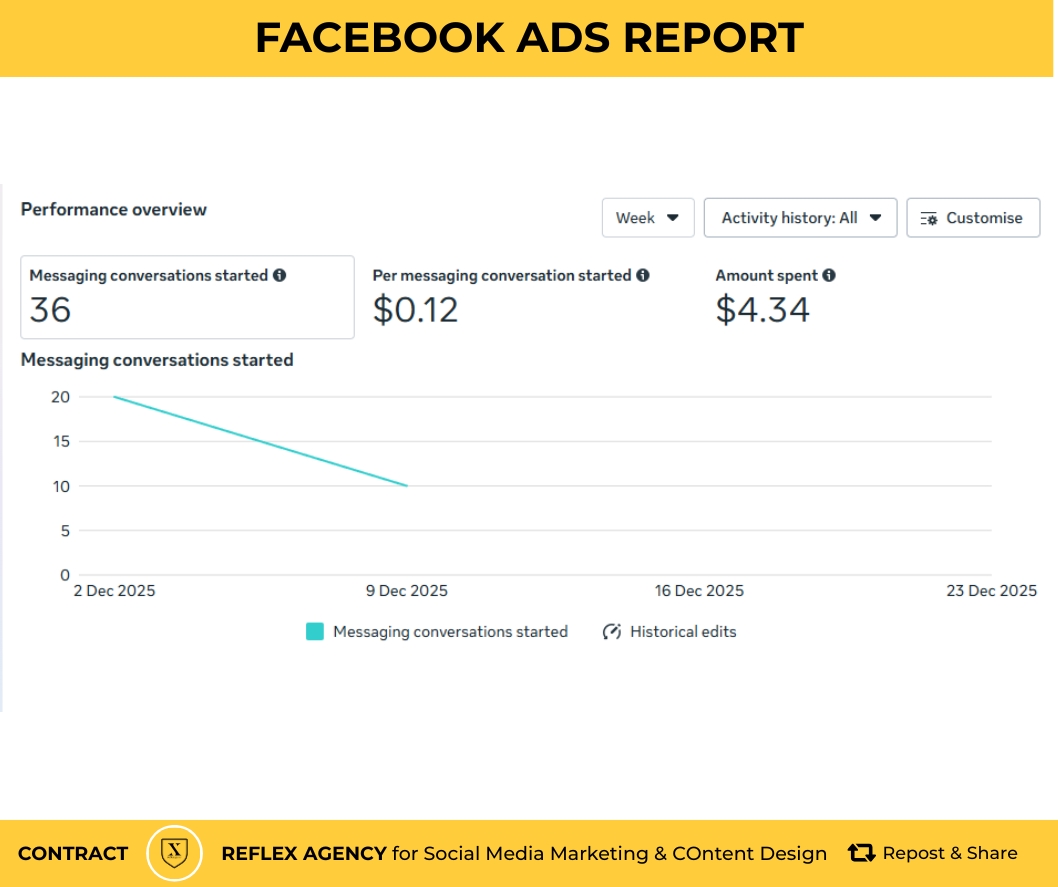
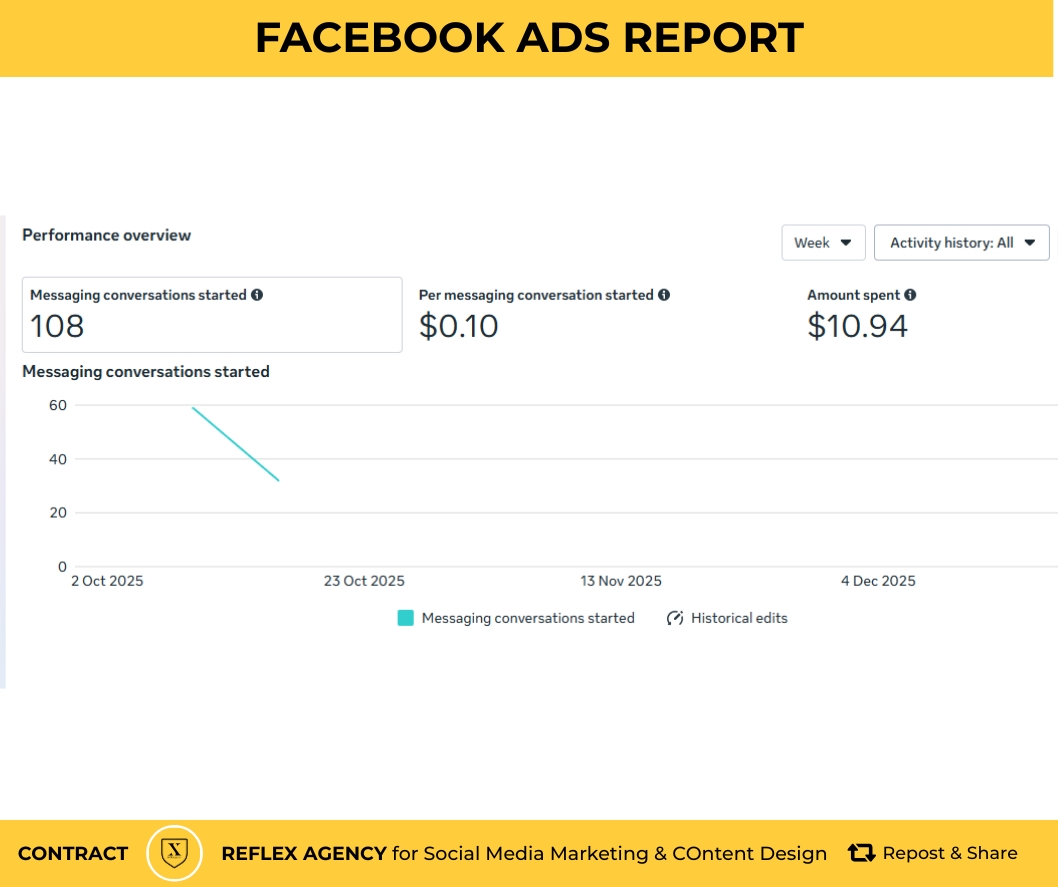
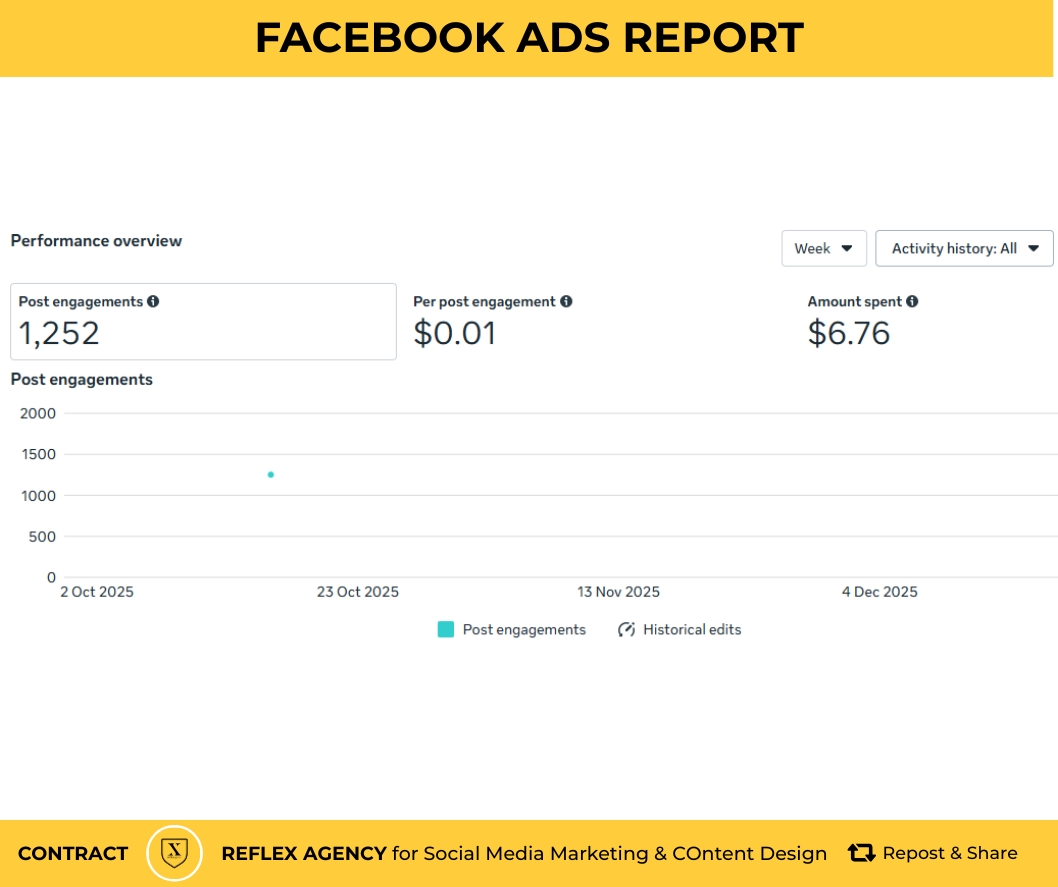
Engagement/Messaging: These are generally more cost-efficient, with engagement costs often ranging from $0.01 to $0.25 per reaction and CPMs for engagement-focused ads typically between $4 and $6.
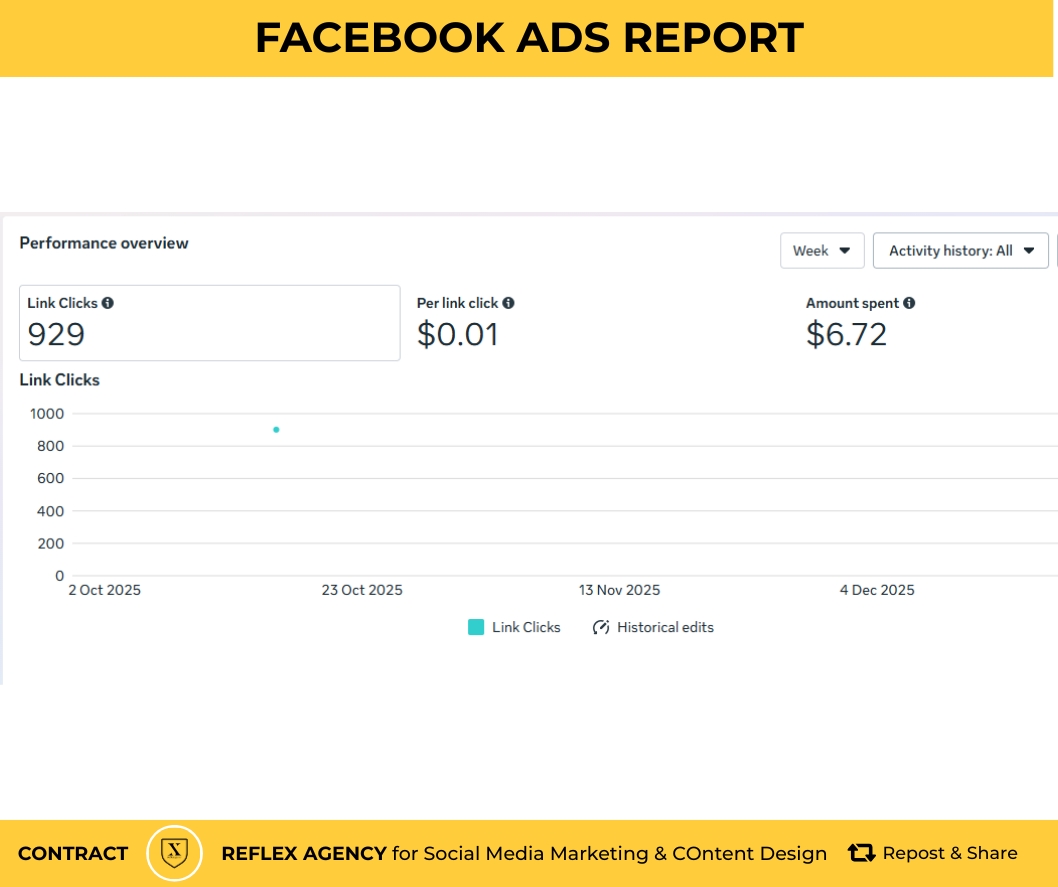
Traffic: Most industries see a lower CPC here, typically averaging around $0.70.
Conversions (Sales/Leads): These are higher-intent and more expensive, with Costs Per Action (CPA) often ranging from $8 to $55 depending on the industry.
Industry-Specific Highlights
Costs vary wildly by sector due to competition and the lifetime value of a customer:
Lowest Costs: Shopping, Retail, and Apparel often see some of the lowest CPCs, frequently below $0.45.
Highest Costs: Finance, Insurance, and Legal services face the highest costs, with CPCs often exceeding $3.70.
Optimization Strategies for 2026
Leverage AI: Utilizing Advantage+ campaigns is now a standard for efficiency.
Creative is King: Ad relevance and quality directly lower your costs. High-performing vertical video (Reels/Stories) can generate up to 12% more conversions.
Broad Targeting: For accounts with sufficient conversion data, broader targeting often provides the Meta algorithm with more “liquidity” to find cheaper opportunities.


