Facebook Ads Report
For most businesses, the following ranges represent “healthy” performance. If your costs are within these brackets, your campaigns are likely performing at or above average.
Key Insights & Observations
| Metric | Report 1 (Dec 2025) | Report 2 (Dec 4 Week) |
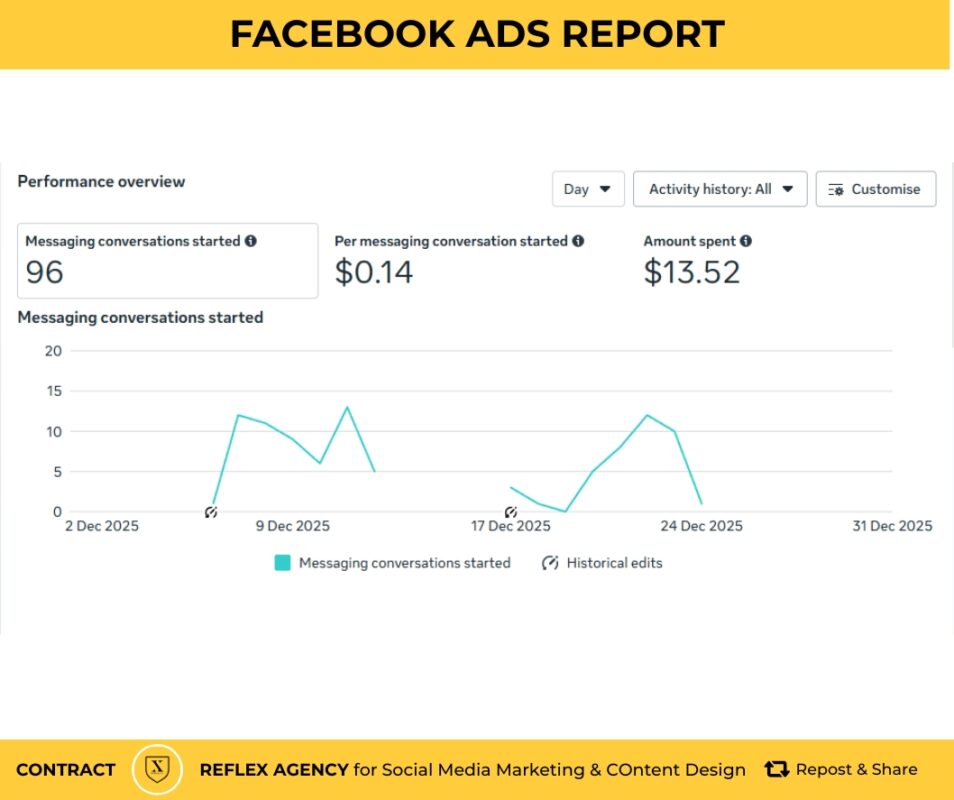
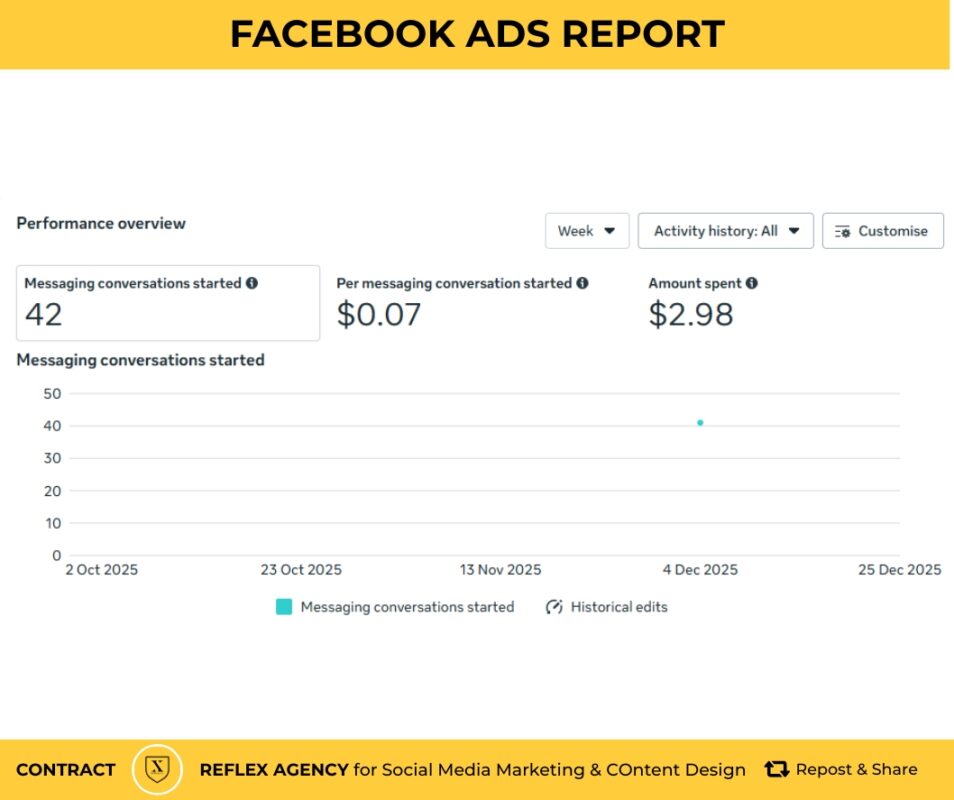
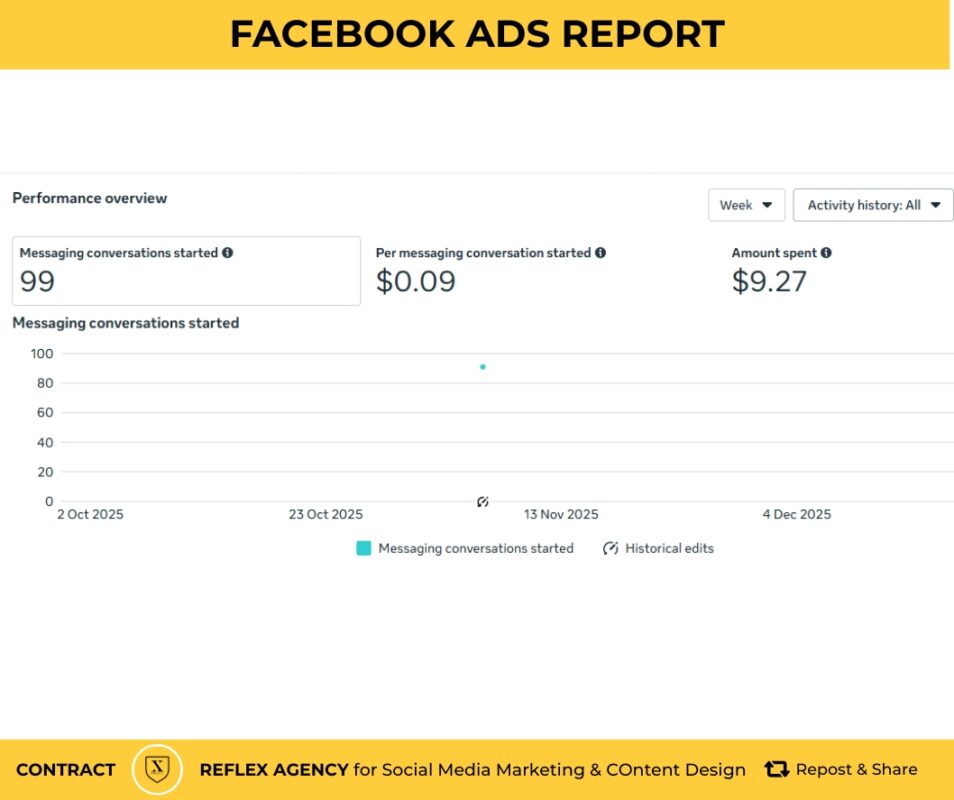
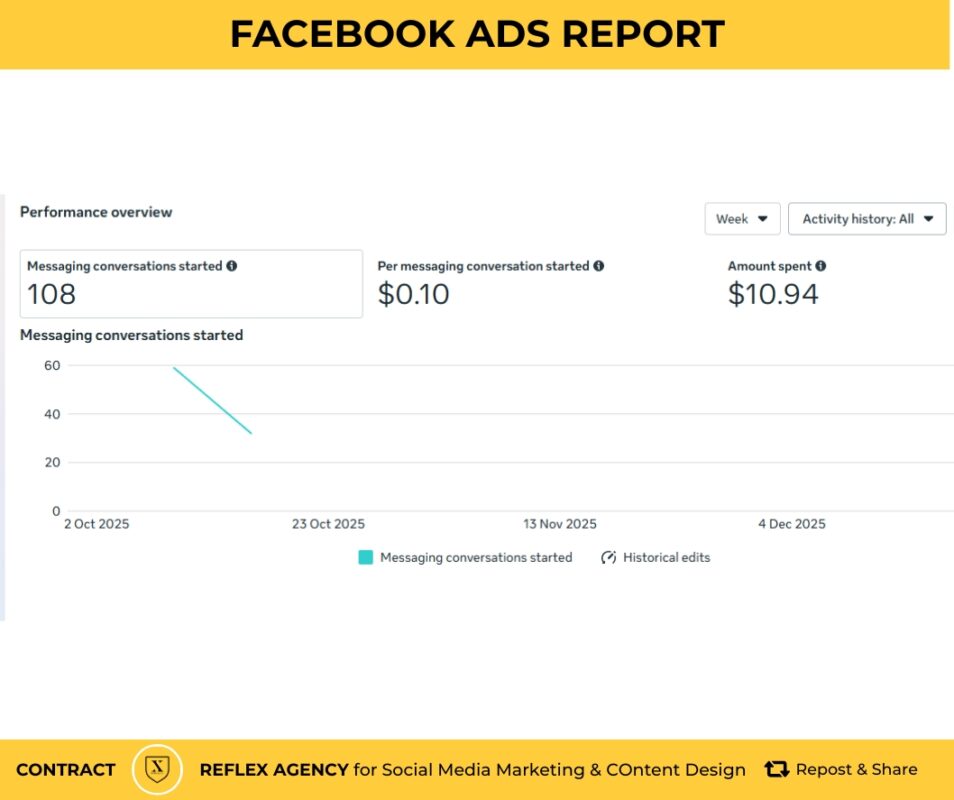
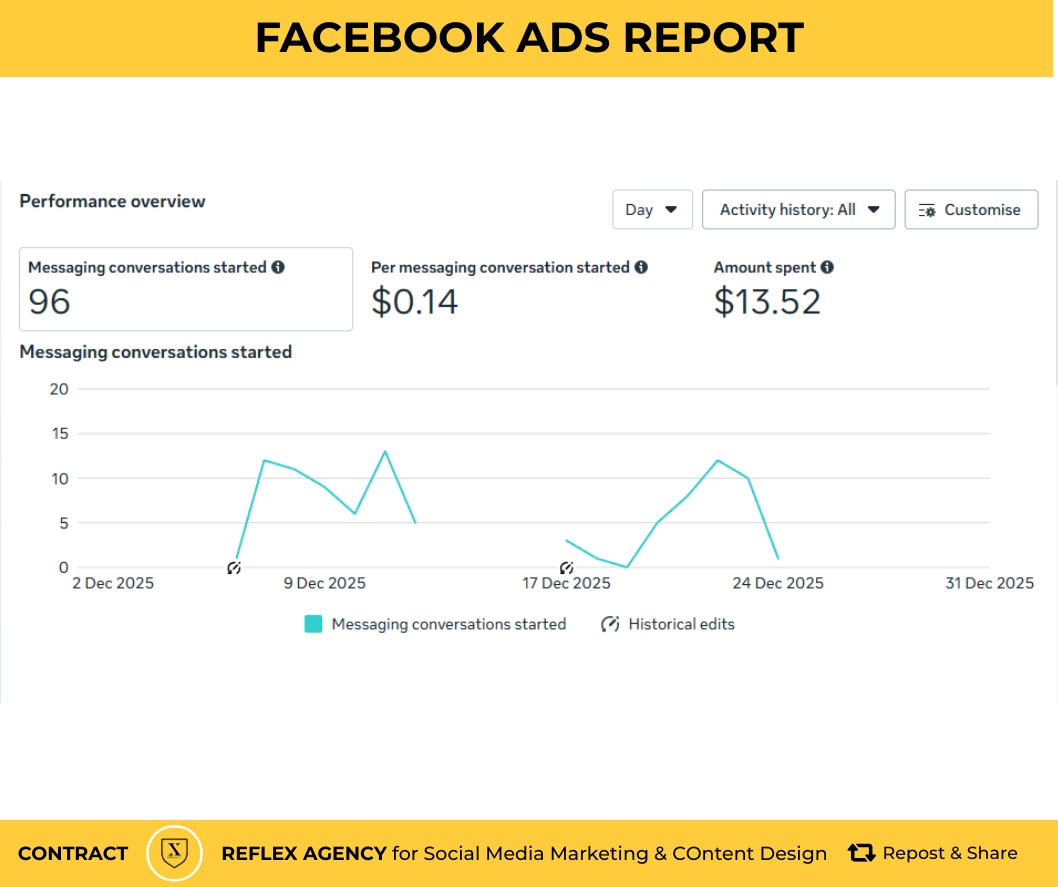
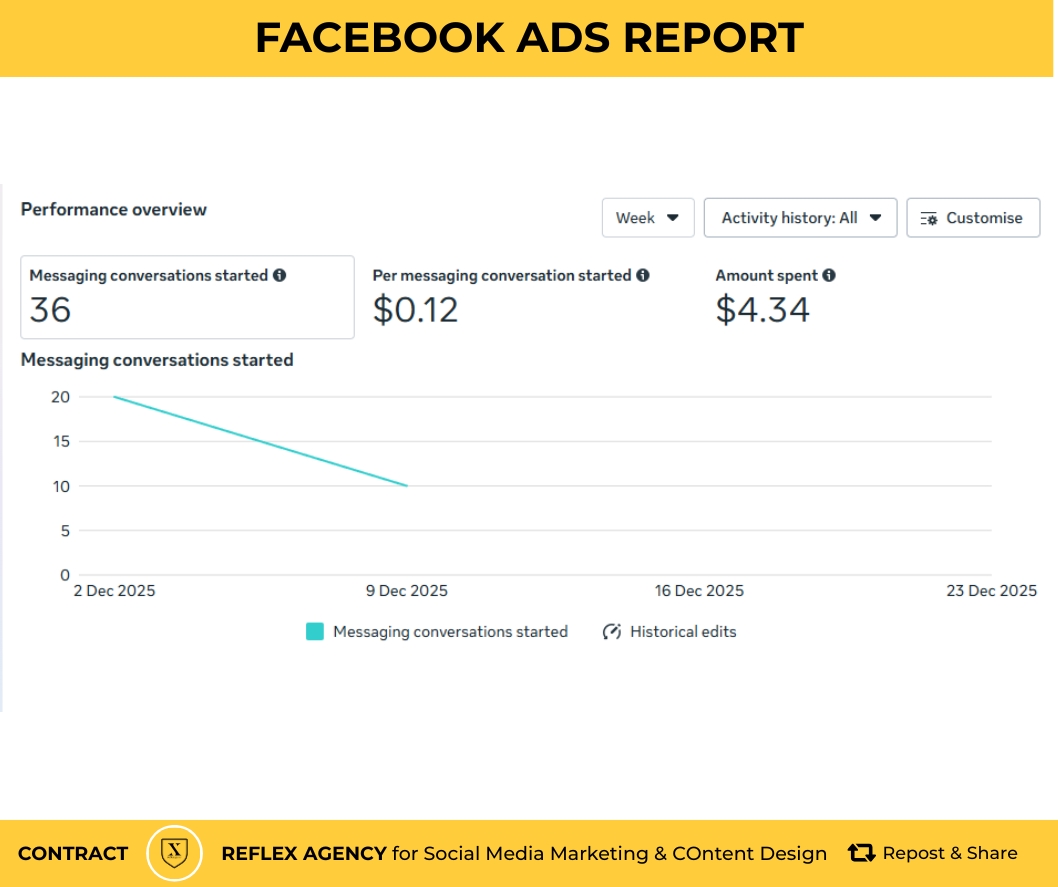
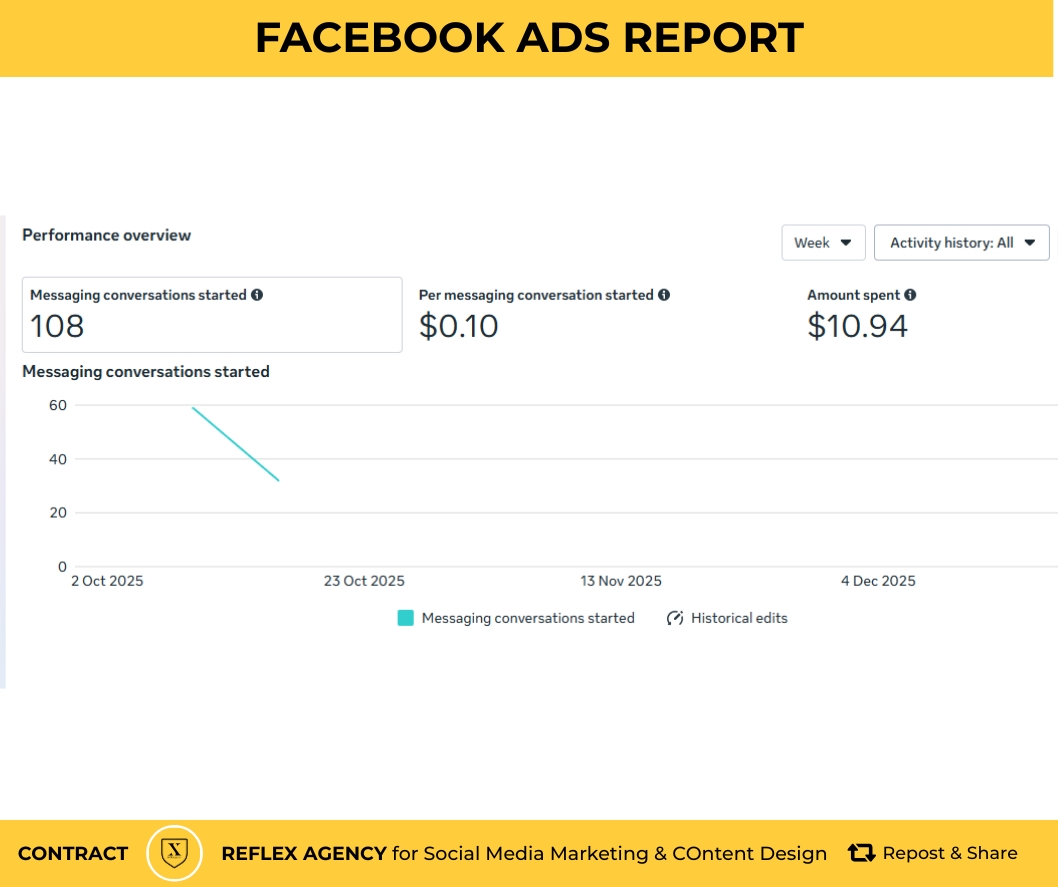
| Messaging Conversations Started | 96 | 42 |
| Cost Per Conversation Started | $0.14 | $0.07 |
| Total Amount Spent | $13.52 | $2.98 |
Cost Efficiency Trend: Your second report shows a significantly lower cost per conversation ($0.07) compared to the first report ($0.14). This indicates that the more recent ad set or timeframe was 50% more efficient in terms of cost.
Benchmark Comparison: In the December report, your cost of $0.14 was flagged as being 41% higher than similar ad sets run by peers, who saw a median cost of $0.10. However, your performance in the second report ($0.07) actually beats that peer median.
Activity Gaps: The performance chart in the first report shows significant gaps in activity (periods with zero conversations), specifically around early to mid-December. This often suggests either a paused campaign or issues with ad delivery during those dates.
Historical Edits: Both reports indicate “Historical edits” were made. These changes to your targeting or creative likely contributed to the fluctuations in cost and results seen throughout the month.


