This Facebook Ads report analysis covers key performance metrics, comparison data, and industry benchmarks for 2025 and 2026.
Facebook Ads Performance Summary
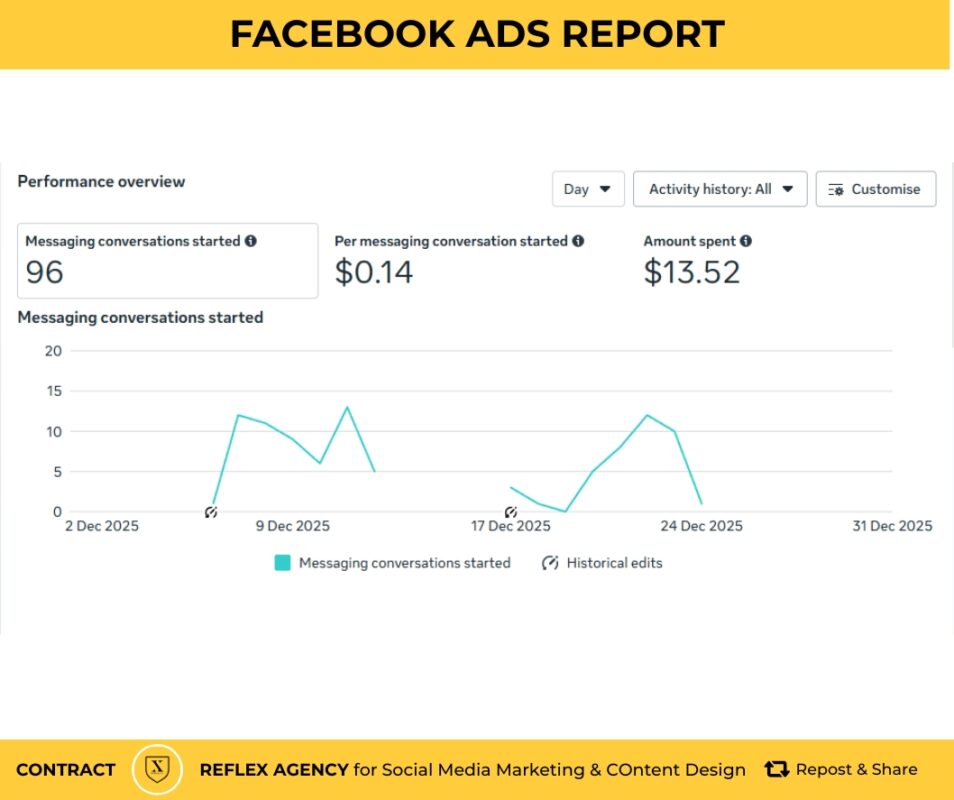
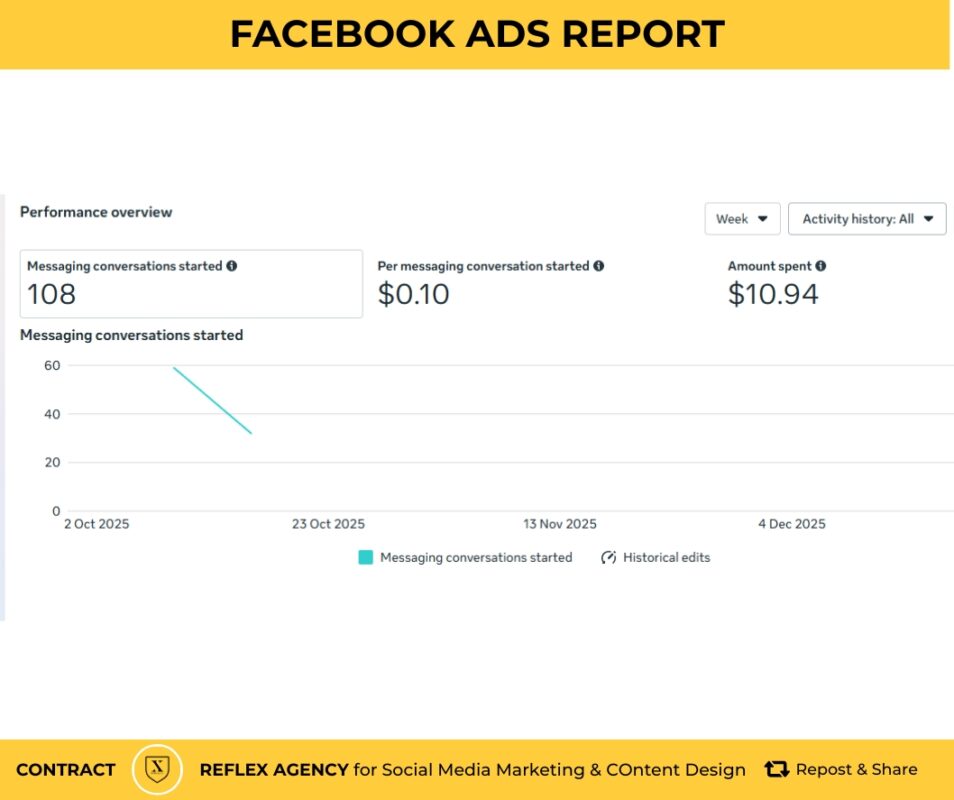
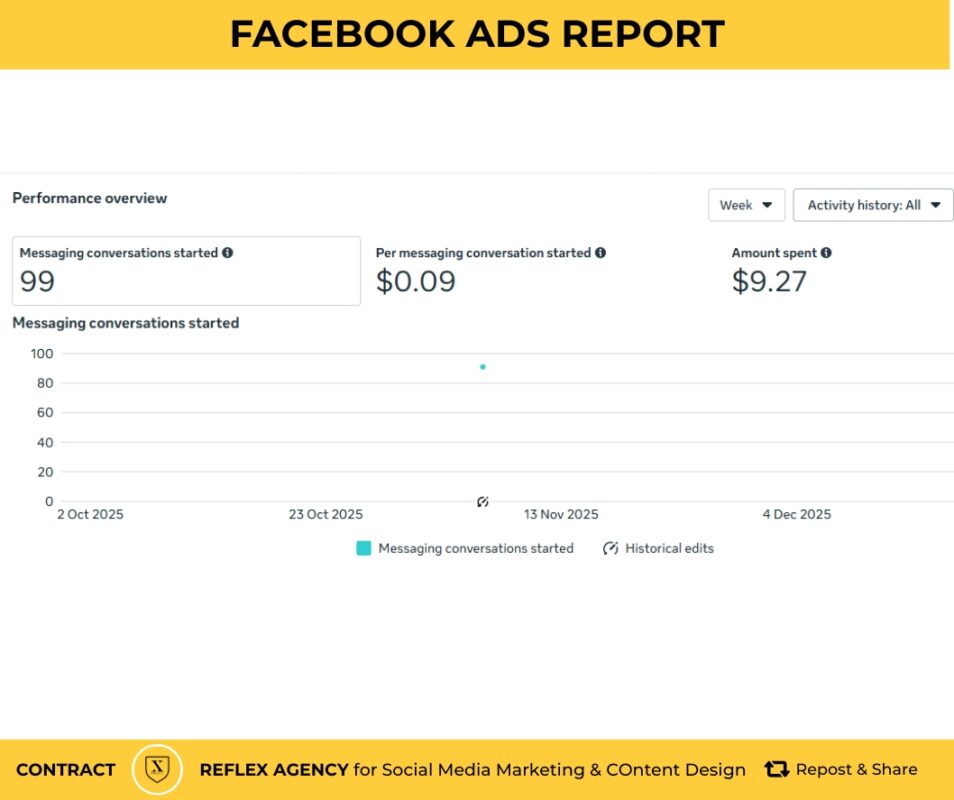
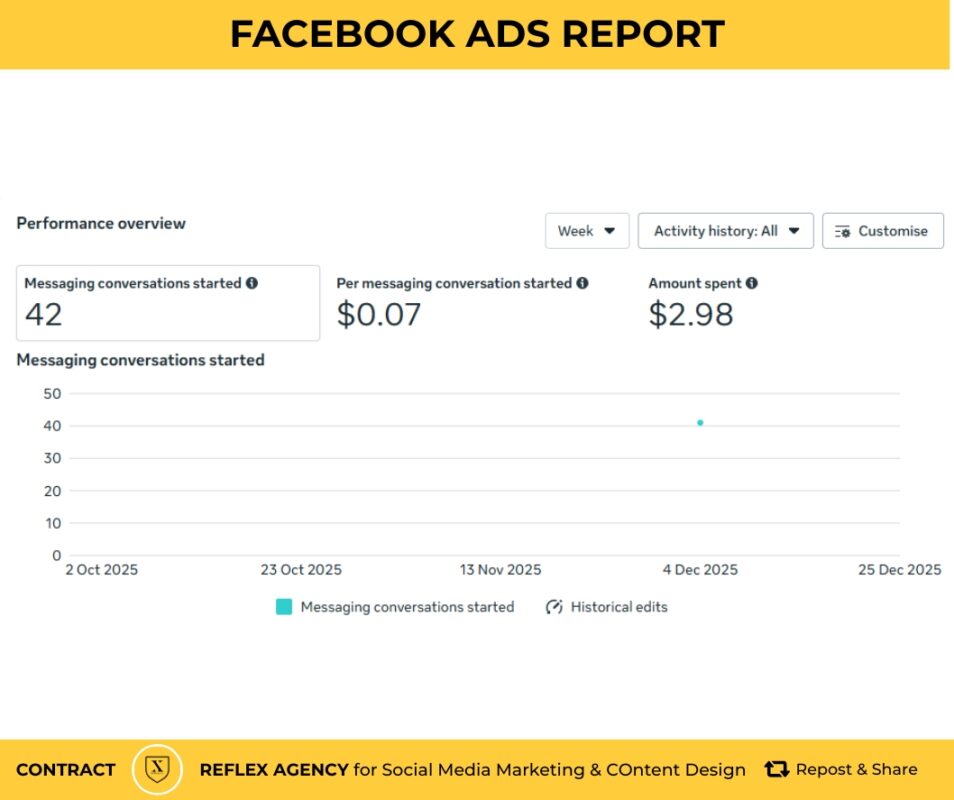
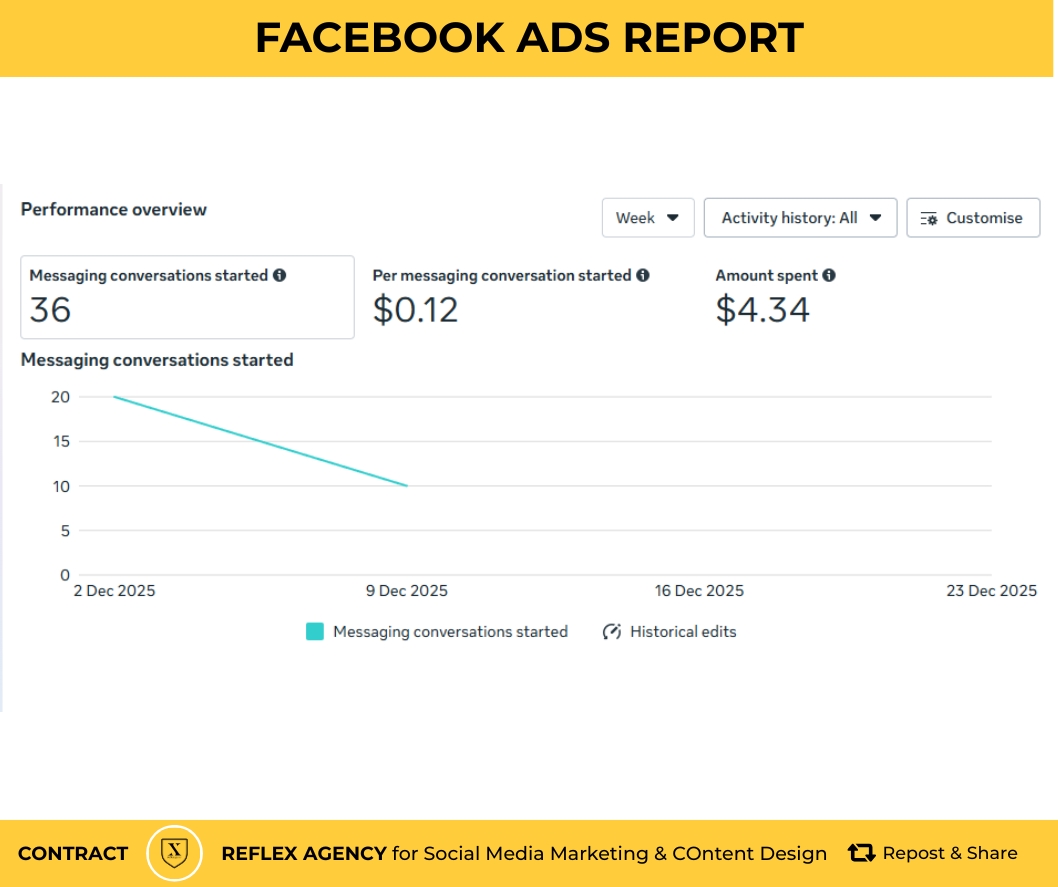
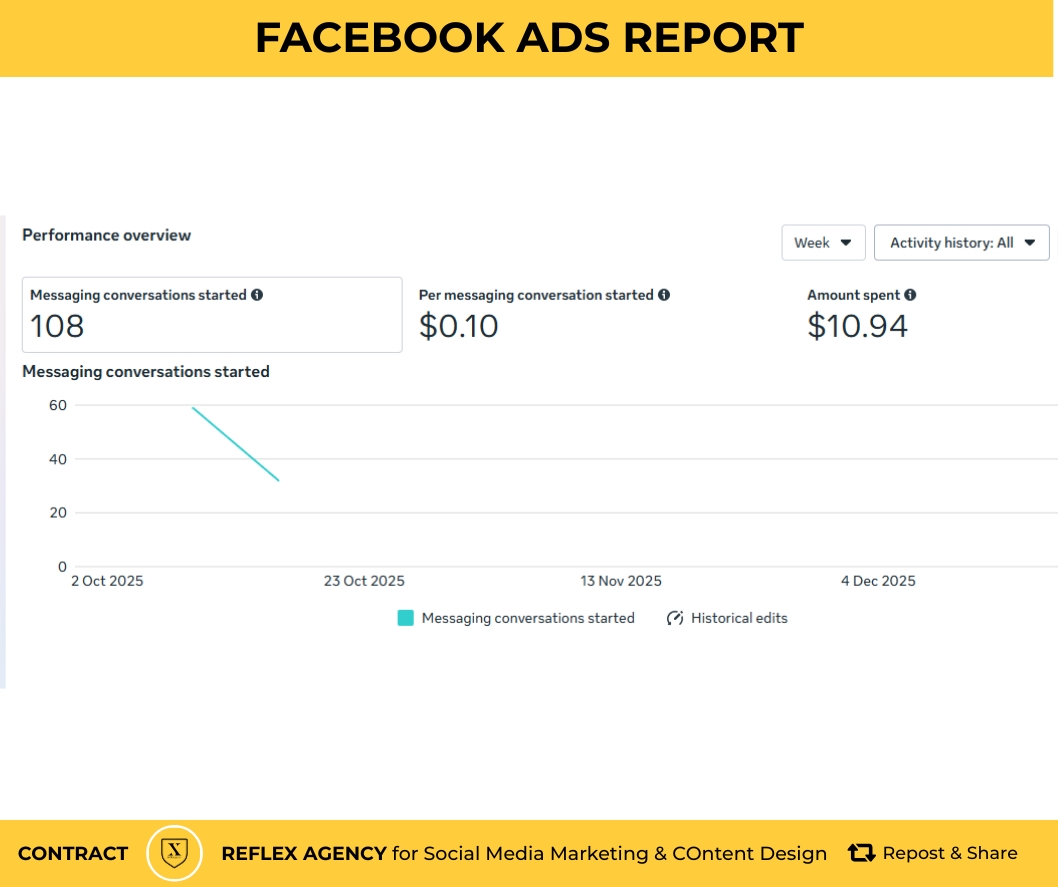
Based on recent reports, your messaging-focused campaigns have shown high cost-efficiency.
| Metric | Recent Performance | Peer Median (2025) |
| Messaging Conversations Started | 42 – 96 | Varies by Budget |
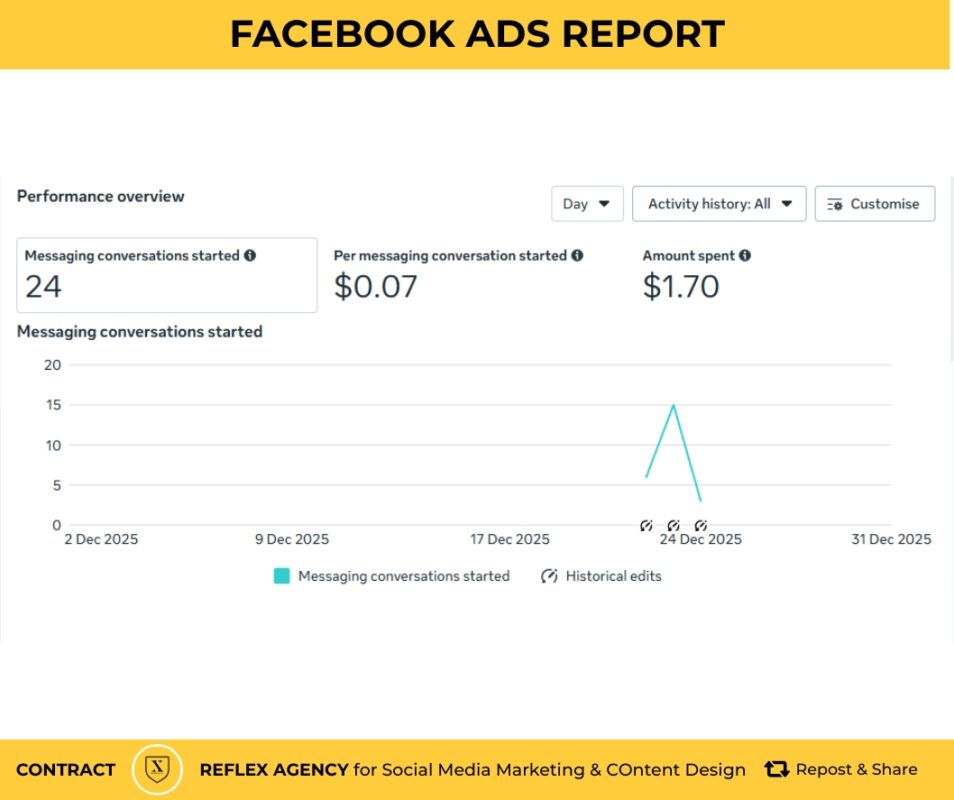
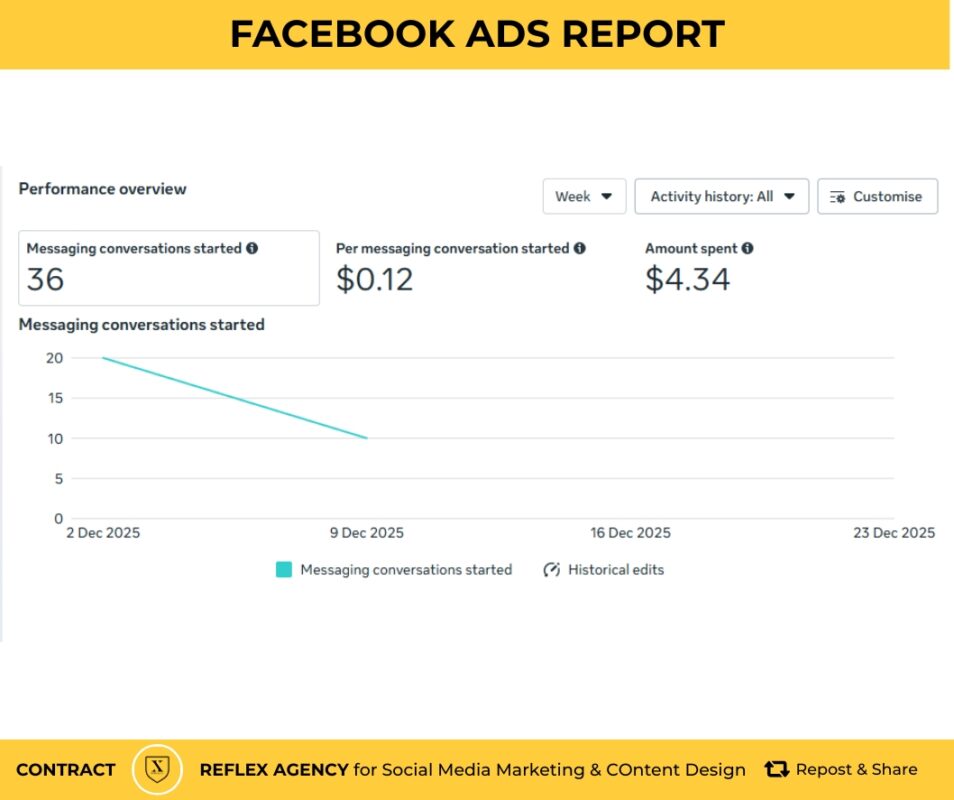
| Cost Per Conversation Started | $0.07 – $0.14 | $0.10 |
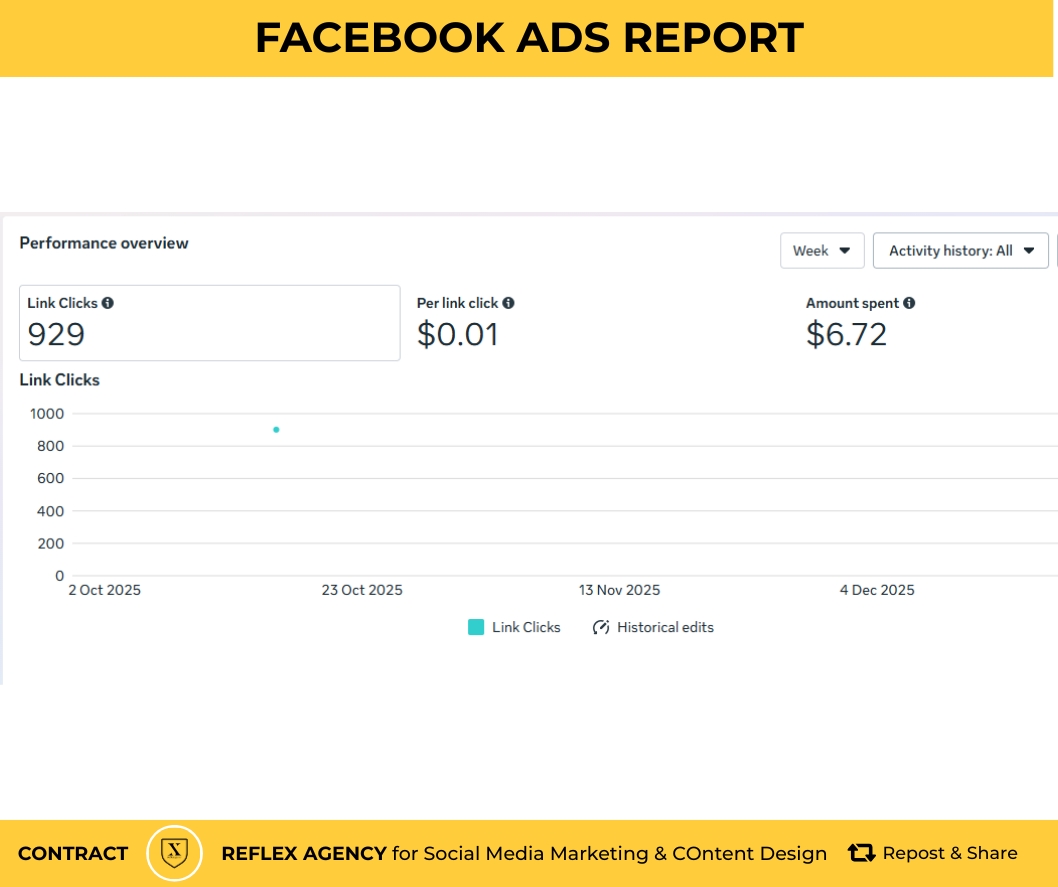
| Average CPC (Cost Per Click) | N/A | $0.70 – $0.82 |
| Average CPM (Cost Per 1,000) | N/A | $8.19 – $13.57 |
Key Detailed Findings
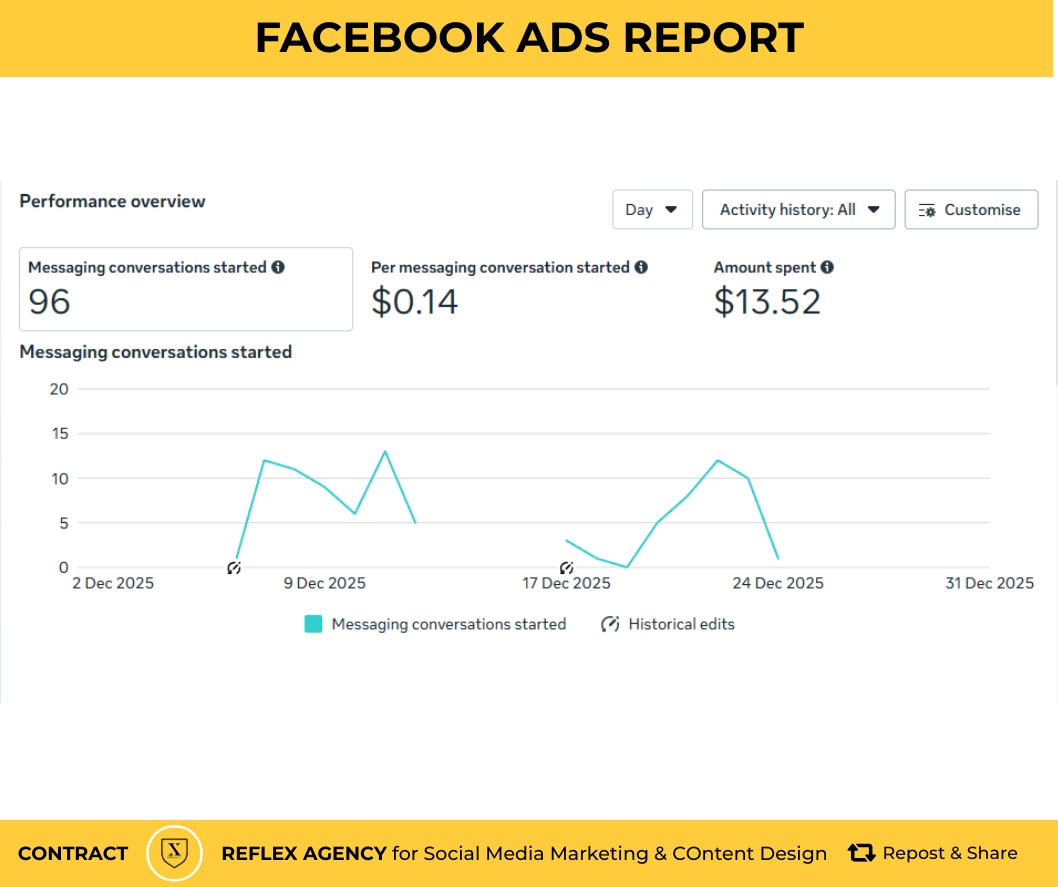
- Cost Efficiency: Your recent performance of $0.07 per conversation is highly efficient, beating the 2025 peer median of $0.10. Earlier reports showed a higher cost of $0.14, which was roughly 41% higher than similar ad sets.
- Result Definition: The “Messaging Conversation Started” metric indicates a user clicked your ad and initiated a chat via Messenger, Instagram, or WhatsApp. This format often sees high open rates (up to 88%) and lower overall CPAs due to direct engagement.
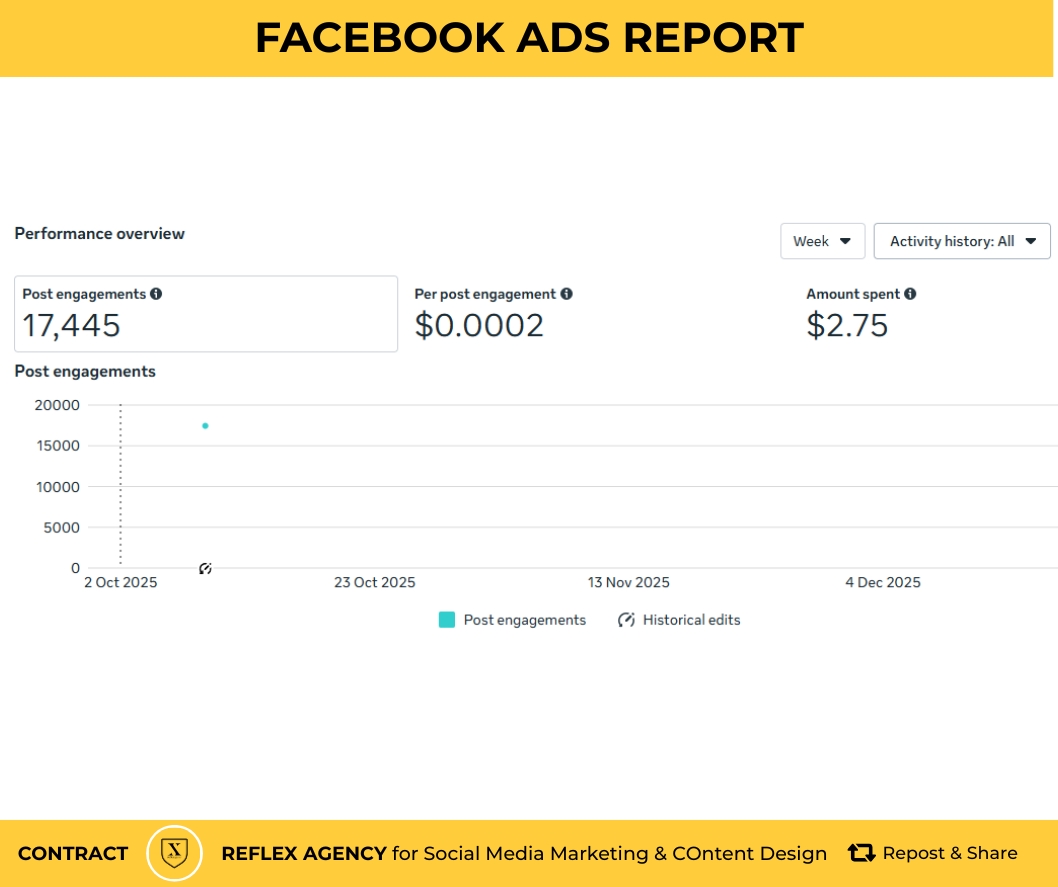
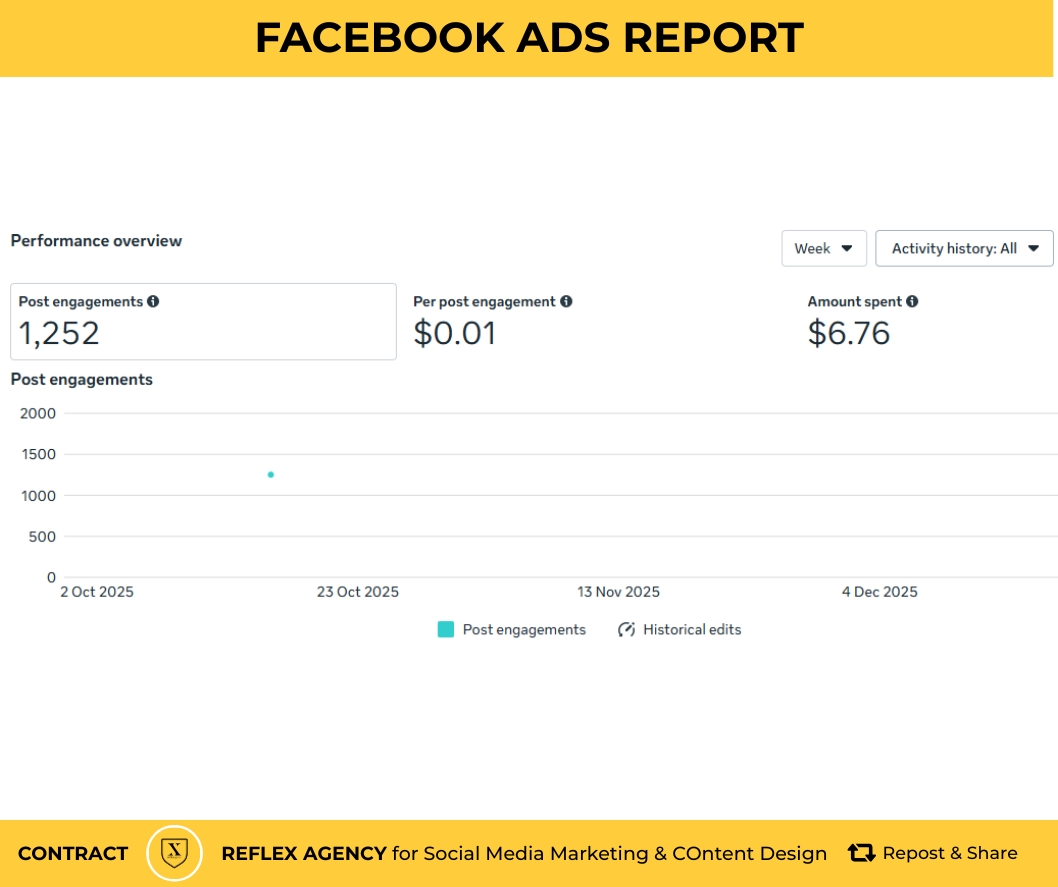
- Activity Fluctuations: Performance charts often show “gaps” or periods with zero results, which may indicate paused campaigns, budget exhaustion, or delivery issues during those dates.
- Impact of Edits: “Historical edits” listed in reports refer to changes in budget, targeting, or creative assets. These adjustments are often the primary driver for shifts in cost-per-result.
2026 Industry Benchmarks
If you expand your campaign goals, these are the standard ranges to expect for 2026:
- Click-Through Rate (CTR): An average range is 0.72% – 1.49%. A CTR above 2.50% is considered excellent.
- Lead Generation: Average Cost Per Lead (CPL) for 2025/2026 is approximately $19.68, though high-competition industries like Finance can exceed $55.00.
- E-commerce: Retail often sees the lowest CPCs at roughly $0.34 – $0.82.
Optimization Tip: Campaigns using Advantage+ (AI-driven targeting) and vertical video formats like Reels typically generate 12% more conversions on average than standard formats.


